- by New Deal democrat
There are some very unusual cross-currents going on in the housing sector, revealed by yesterday’s existing home sales report. But it will take some time-intensive organization to present it to you, so I’m saving it for (hopefully) Monday.
In the meantime, let’s take another look at the job market and how it compares with consumer spending.
One of my favorite long-time graphs has been that the YoY% change in real retail sales, /2, forecasts the YoY% change in jobs growth, with a delay of some months. Here’s the latest update of that:
Works like a charm, until the pandemic. Then there’s a disconnect, first on the downside (2020) for jobs, as they declined over 5% vs. over 2% growth in sales), and then on the upside (2022-23), with an actual decline in sales vs. over 2% growth in jobs.
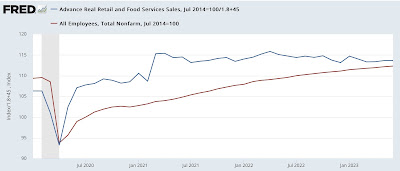
When will the disconnect resolve itself? For that, let’s take a different look at the same data. The above implies that sales grow faster than jobs, vs. their long-term trend in the first part of an expansion, and sales grow slower than jobs in the last part. To show that, I’ve normed both real sales and job growth to 100 as of the mid-point for jobs growth in the last expansion in mid-2014. Because sales historically have tended to grow almost twice as fast as jobs, I account for that mathematically in the sales data.
Here’s what the last 30 years look like:
This shows that sales exploded in 2020 and 2021 with the pandemic stimulus, while jobs initially plummeted and then grew back strongly.
Now let’s zoom in on the post-pandemic era:
Real sales have been flat to slightly declining over the past 2 years. Meanwhile jobs have almost entirely caught up, and are now only 1% (about 1.5 million jobs) under trend compared with their pre-pandemic norm. This can be resolved by a further decline in sales, a further increase in jobs, or both.
Which brings me to the job openings data from the latest JOLTS report:
Over the past 16 months, job openings have declined about 50% towards their pre-pandemic level. If that trend continues, in about another 16 months the anomaly will have disappeared.
The sales vs. jobs data highlighted previously above suggests that it will be quicker than that, on the order of 6 to 12 months. At that point the historically tight labor market will revert to mean, and an actual downturn in jobs in response to flagging sales would become much more likely.


