- by New Deal democrat
Aside from the Fed’s rate decision which will be announced this afternoon, it’s a slow economic news week. In general, the punditry which I read seems to be settling on a consensus that we are going to manage to have a soft landing. With the exception of jobs and payrolls, the rest of the indicators I track in sequence continue to indicate a recession is near. Let me update three high frequency indicators I’ve been paying particular attention to.
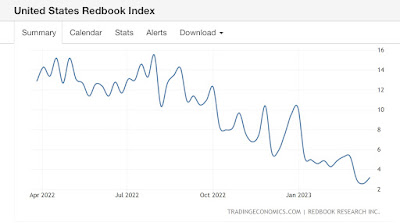
1. Redbook consumer spending
This is a weekly update of same store spending, measured nominally YoY. The trend here is pretty self-explanatory:

YoY consumer spending was holding up in double-digits until the middle of last summer. Since then the trend, albeit with some waxing and waning, has been pretty consistent. The average of the last 3 weeks has been just below 3% YoY.
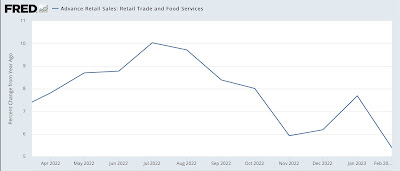
For comparison, here is monthly nominal retail sales YoY since last March:
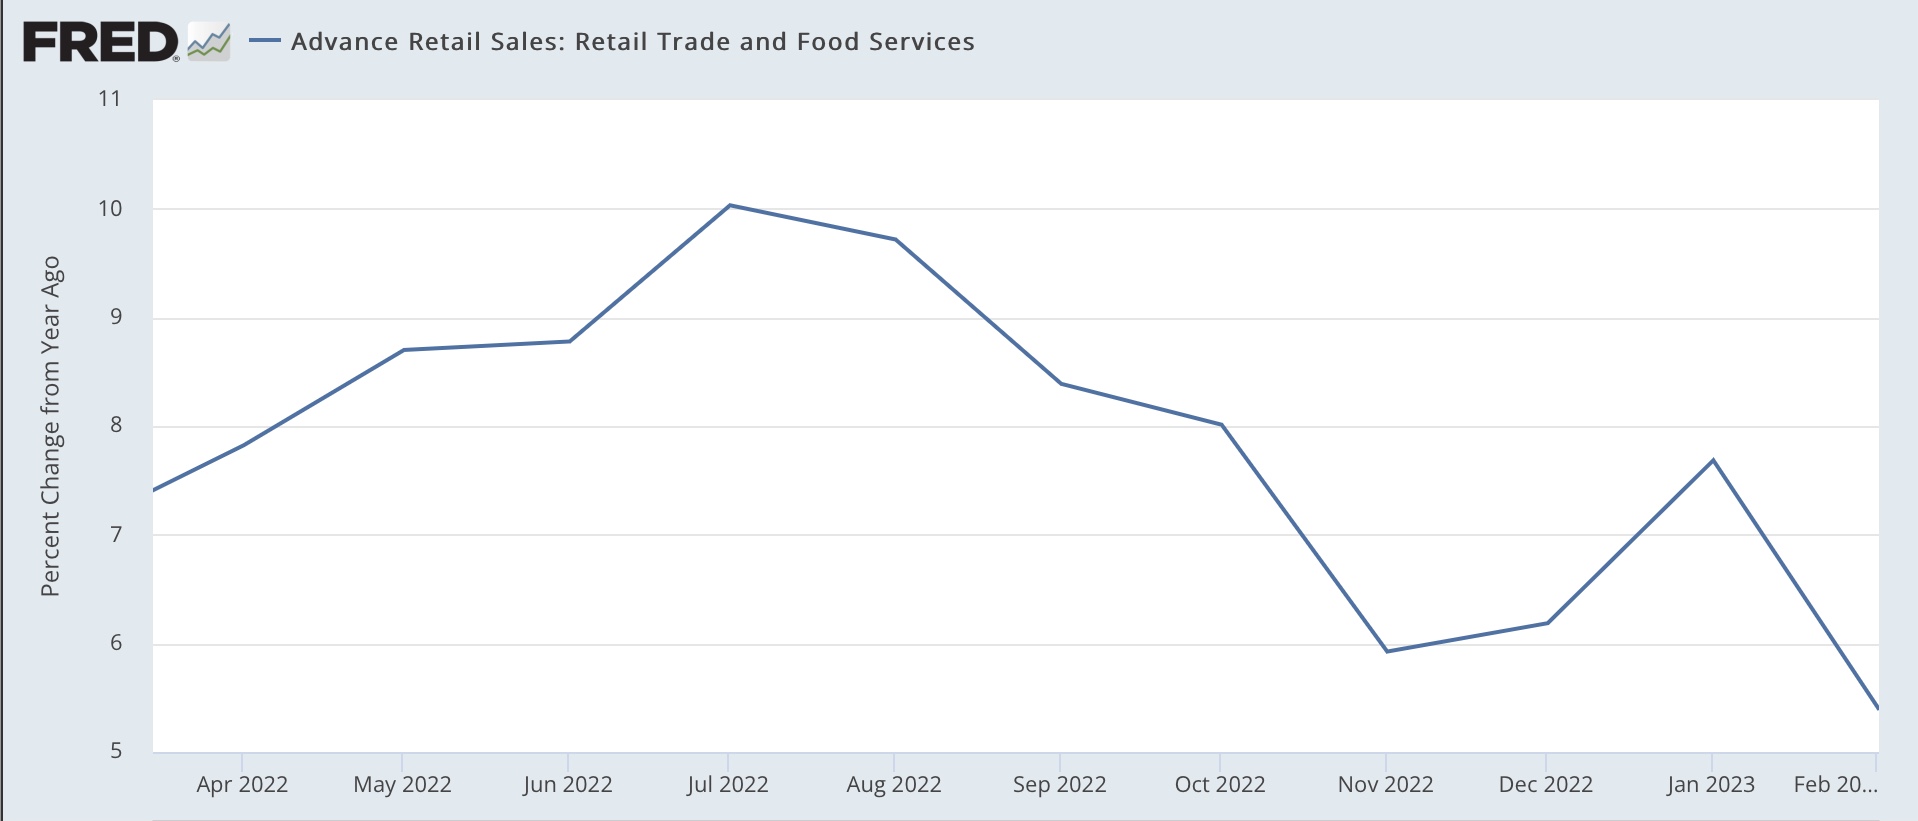
The trend is similar, but the decline in Redbook has been considerably more pronounced. If the monthly series follows, March nominal retail sales will decline further YoY. And as indicated that’s before consumer inflation is taken into account, which as of February was 6.0% YoY.
Further, if the trend continues, even nominally Redbook will be negative YoY by midyear.
2. Temporary employment
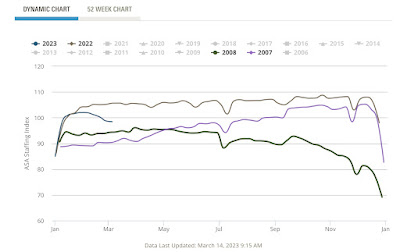
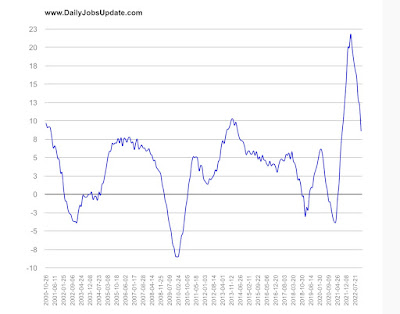
Temporary employment is a leading sector of the jobs market. The American Staffing Association has been posting a “Staffing Index” since 2006. Typically the Index slowly increases during the year, with major seasonal fluctuations around the 4th of July, Thanksgiving, and Christmas-New Year’s. Here’s what it looks like since January 2022, and the onset of the Great Recession, 2006-07, for comparison:

The 6% YoY downturn in February through early March this year has been the biggest since the series was begun. That being said, there was a similar downturn in late 2015 (not shown) without the economy coming close to recession.
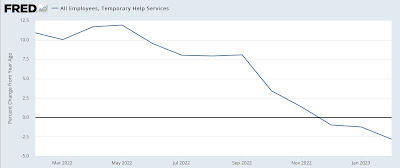
For comparison, note that there has been a similar YoY downturn in termporary employment in the official payrolls report:

The last few weeks suggest this downturn in the monthly jobs report will continue.
3. Payroll tax withholding
This is a decent coincident proxy for the total jobs market. Almost everybody pays payroll taxes, and it stands to reason if wages and/or jobs growth stagnate, so will the taxes from those paychecks.
Matt Trivisonno of the Daily Jobs Update keeps track of these graphically, and makes a free graph available with a 90 day delay. Which means that the below graph includes the period up through roughly December 15. By way of further explication, the comparison is taxes paid during the entire previous 365 day period, vs. the entire 365 day period before that:

YoY payroll taxes peaked at about 22% in March 2022. Remember that my rule of thumb for non-seasonal adjusted data is that it probably has peaked if the YoY comparison has declined by more than 50% within the ensuing 12 months.
As of December 15, this had declined to about 8.5% - i.e., more than half, suggesting that, if we could seasonally adjust, we would find that payroll taxes paid had turned negative.
Because the data is public at the Department of the Treasury’s site, I can further report to you that as of March 20, the entire previous 365 day period resulted in 5.9% more payroll taxes paid than the 365 day period between March 20, 2021 and March 20, 2022. This is almost a 75% YoY decline.
But the data is a little more nuanced. During the 1st fiscal Quarter of 2022-23, payroll taxes paid were only 1.2% higher than Q1 of 2021-22. So far in the fiscal 2nd quarter this year, taxes are up 7.1% compared with Q2 of 2022 through March 20. That’s a pretty strong rebound.
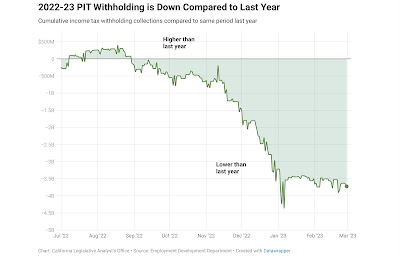
And the rebound accords with information provided by California’s Treasury Department, shown below:

After a steep YoY decline in late 2022, there has been no further YoY decline in 2023 so far. Since California includes about 1/8th of the entire US population, and an even bigger share of the economy, this is good information.
Interestingly, the Treasurer’s Office for California indicated that they believed the big shortfall in 2022 was due to the downturn in the stock market, which meant that stock options tied to an increase in share prices could not be cashed. The stock market recovered pretty nicely between November and February, so likely some of those stock options were now in the money and could be cashed.
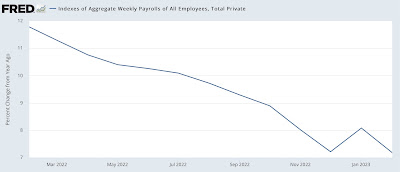
Probably the closest monthly analog is aggregate payrolls in the jobs report, shown YoY below:

Again, there is deceleration, but no nominal downturn yet.
Put the three data series together, we see that two short leading indicators, temporary help and consumer spending adjusted for inflation (since consumption leads employment) have turned down, but no coincident downturn in overall employment. In short, no recession yet, but no paucity of yellow flags.