- by New Deal democrat
As I’ve mentioned several times in the past month, as of the latest readings it looks like industrial production (blue), and its manufacturing component (red) as well, are either on the verge of turning down, or may have already peaked:
Yesterday I noted that several leading indicators for this, the ISM manufacturing index and its new orders component, and also the manufacturing work week, had already turned down to recessionary levels. It would be unusual if production did not follow.
With regard to sales, the picture is more complicated.
The NBER has indicated it looks to real manufacturing and trade sales for guidance. Here’s what it looks like for the past year:
Like GDP, it turned down during late winter and spring (coincident to gas prices going from $3.40 to $5/gallon), and recovered nicely since then (coincident to gas prices going back down to $3/gallon).
The “real” part means the nominal data is deflated, but unfortunately I’ve been unable to find information as to the method used for the deflator. Also, note that it is reported with a 2 month+ lag; the latest data is for October.
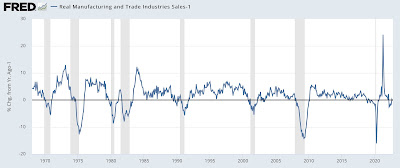
Even so, on a YoY basis through October real sales are up just 1%. In the past that weak a YoY comparison has almost always occurred shortly before or shortly after a recession has begun (but see 2002 and 2016):
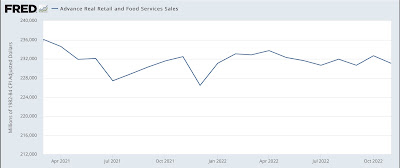
Also, we do have real retail sales through November, which have been flat to down for a year:
That leaves the manufacturers and wholesalers components of real sales. Here’s what they, along with retail sales, look like nominally for the 20+ years up until the pandemic (in log terms; manufacturing on right scale):
And here is what they look like since:
Note that both manufacturers and wholesalers sales turned down even in nominal terms before the onset of the 2001 and pandemic recessions. In all cases wholesalers sales turned down in tandem with or slightly after manufacturers sales. Retail sales have been their own animal, and have been much less volatile.
Next, here are nominal manufacturers sales since the pandemic started, normed to 100 as of December 2021, compared with wages (red) and commodity inputs (gold):
It’s pretty easy to see that commodity deflation since June explains the rebound in “real” manufacturers sales.
Now let’s turn to wholesalers, showing their nominal sales, also normed to 100 as of December 2021, compared with wages and final demand producer prices:
Even nominally, wholesaler sales peaked in June. Producer prices have been generally flat since then, and wages higher, strongly suggesting that “real” wholesaler sales have declined more significantly in the past few months.
Finally, here is yesterday’s data comparing wholesalers’ sales (blue) and inventories (red):
In the aggregate, it has always been the case that inventories only turn after sales. As of yesterday, as noted above even nominal sales are down, while inventories are increasing. This is the marker of the onset of a recession.
In summary, two of the three components of sales - retail and wholesale - appear to have turned down. The final component - manufacturing - shows plenty of weakness when it comes to production. The issue will be whether manufacturing’s commodity inputs have continued to decline in price, or whether that too has reversed. If so, real manufacturing and trade sales may already have peaked, although we won’t find out until the data is reported in late February or March.


