- by New Deal democrat
As promised, here is my second post on the April CPI number.
The YoY advance in consumer prices, +8.3%, is down from last month’s 8.6%, which was the highest 12 month rate since 1981. As I suggested last month, “the spike in gas prices may be - to use a recently dreaded word - transitory,” since gas prices had declined 5% month over month at the time of last month’s report. In the April report, energy prices declined -2.7%, and since they are 8% of the total weighted, that was certainly helpful. So far this month they have been more or less steady.
There was also good news in that the price of used cars and trucks fell -0.4% in April, after declining -3.8% in March. They constitute another 4% of the weighting of the CPI. As a result, the price of used vehicles was “only” up 22.7% YoY, vs. 41.2% YoY in February (which was the highest YoY increase in 70 years):
As I noted last month, used vehicle prices are down because they have become unaffordable for enough people that sales of such vehicles has also turned down.
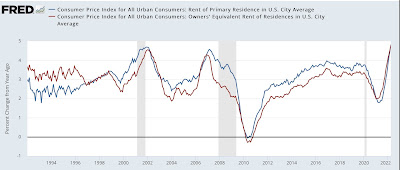
Now let’s focus on the housing component of CPI, which constitutes 32% of the total input. There, both rent, and the much larger CPI component of owner’s equivalent rent, which is how house prices are figured into inflation, rose 0.6% and 0.5% respectively, for the month, and are up 4.8% YoY, respectively. This is the highest YoY rate of housing inflation for either measure in over 30 years:
I continue to expect the housing component of inflation to worsen considerably. That’s because, as I first pointed out half a year ago, the major house price indexes - the FHFA index and the Case Shiller index - lead owners equivalent rent by roughly 12 to 24 months, particularly in major moves.
The below graph shows the YoY% change in both house price indexes in shades of blue, compared with the YoY% changes in the CPI measures of rent of primary residence, and owners’ equivalent rent in shades of red:
There have been 3 major pulses of house price increases in the last 25 years: in 1997-98, 2004-06, and 2020-present. In each case, after roughly a 12-24 month lag, both CPI rent measures surged as well. That’s because big surges in house prices make renting more attractive (or necessary for those on more limited budgets); this drives more demand for apartments, which drives rent increases. Further, the current rise in house prices of nearly 20% YoY, is significantly worse than either of the previous two - and has been up almost 20% YoY for the last 8 months running. With CPI housing inflation already at a 20 year high, we can further record CPI housing increases as this year progresses.
As I have also pointed out before, before owners equivalent rent is fully passed through into CPI, total inflation has normally cooled, as shown in the graph below:
That is because, faced with surging inflation, the Fed has embarked on a series of rate hikes (shown in black above) that culminated before owners equivalent rent peaked. The economy buckled, recessions started, and total inflation subsided as a result, before owners equivalent rent had fully peaked.
Unfortunately, even after the record surge in house prices was in full swing over a year ago, the Fed stayed on the sidelines. Now, as both rents and owners’ equivalent rents surge as well, and the Fed has so far only increased rates by 0.75%. Last month I wrote that “now the Fed is almost certainly going to stomp on the brakes, with a hard landing to follow;” and I would say that last week’s 1/2 point increase, the first in 28 years, was just the beginning of that stomping.
Let me conclude this month’s installment by exactly restating my closing paragraph from last month’s installment, because it certainly is the object lesson for the Fed:
It’s too late for this cycle. But with three examples of surging house prices feeding through with a delay into the CPI in the past 25 years, in the future the Fed simply *must* pay attention to house prices as reflected in those indexes. Better a small tamping down of the economy early than a major sudden stop later.


