- by New Deal democrat
This is the second part of my take on the March consumer inflation report.
As you may have already read, total inflation clocked in at +1.2% for March alone! YoY consumer prices are up 8.6%, the highest 12 month rate since 1981. As anticipated, gas prices were a huge contributor; less energy, prices were up 0.4%; less both food and energy they were only up 0.3%:
The spike in gas prices may be - to use a recently dreaded word - transitory. In the past 4 weeks, gas prices are down 5%; as of this morning oil prices, which had been as high as $123/barrel on March 8, are back under $100.
There was some small good news in one sector: the price of used cars and trucks fell -3.8% in March:
but prices are still up 35% YoY:
And of course, used vehicle prices are down because they have become unaffordable for enough people that sales of such vehicles has also turned down.
But I want to focus on the housing component of CPI, which constitutes over 33% of the total input. There, both rent, and the much larger CPI component of owner’s equivalent rent, which is how house prices are figured into inflation, rose 0.4% for the month, and are up 4.4% and 4.5% YoY, respectively. This is the highest YoY rate of housing inflation for either measure since 2002.
Further, I fully expect the housing component of inflation to continue to worsen considerably. That’s because, as I first pointed out half a year ago, the major house price indexes - the FHFA index and the Case Shiller index - lead owners equivalent rent by roughly 12 to 24 months, particularly in major moves.
The below graph shows the YoY% change in both house price indexes in shades of blue, compared with the YoY% changes in the CPI measures of rent of primary residence, and owners’ equivalent rent in shades of red:
There have been 3 major pulses of house price increases in the last 25 years: in 1997-98, 2004-06, and 2020-present. In each case, after roughly a 12-24 month lag, both CPI rent measures surged as well. That’s because big surges in house prices make renting more attractive (or necessary for those on more limited budgets); this drives more demand for apartments, which drives rent increases. And the current rise in house prices of nearly 20% YoY, is significantly worse than either of the previous two. With CPI housing inflation already at a 20 year high, we can further record CPI housing increases as this year progresses.
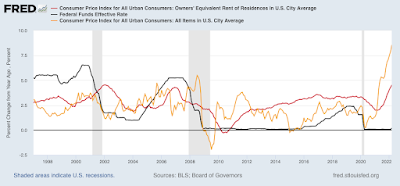
As I have also pointed out before, before owners equivalent rent is fully passed through into CPI, total inflation has normally cooled, as shown in the graph below:
But that is because, faced with surging inflation, the Fed has embarked on a series of rate hikes (shown in black above) that culminated before owners equivalent rent peaked. The economy buckled, recessions started, and total inflation subsided as a result, before owners equivalent rent had fully peaked.
Unfortunately, even after the record surge in house prices was in full swing over a year ago, the Fed stayed on the sidelines. Now rents, and owners’ equivalent rents, are surging as well, and the Fed has only made one 1/4 point rate hike. Now the Fed is almost certainly going to stomp on the brakes, with a hard landing to follow.
It’s too late for this cycle. But with three examples of surging house prices feeding through with a delay into the CPI in the past 25 years, in the future the Fed simply *must* pay attention to house prices as reflected in those indexes. Better a small tamping down of the economy early than a major sudden stop later.


