- by New Deal democrat
As you know, I consider housing, and in particular single family housing permits, one of the very best long leading indicators for the economy. In the past year, however, there has been a unique divergence between housing permits and housing starts, necessitating some adjustments.
In the past year permits soared then sank, while starts held much more steady. The explanation for the divergence is the huge number of housing units for which permits have been taken out, but on which construction has not started. In February that metric increased again, to the highest such number since 1974: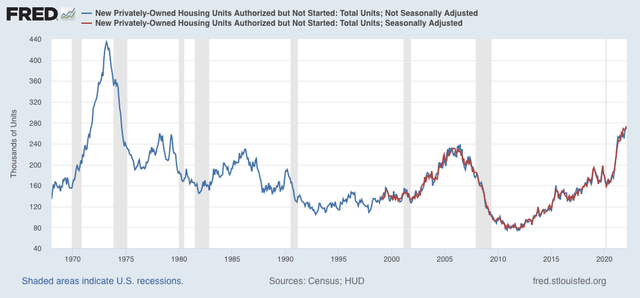
There are simply a huge number of units that *could* be started, but haven’t, probably because of a shortage of some necessary materials.
With that in mind, let’s turn to total housing starts (blue), total permits (dark gray), and single family permits (red, right scale):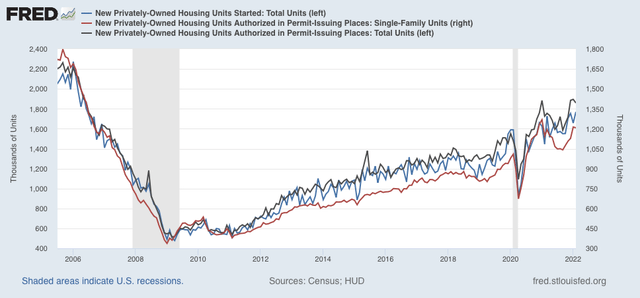
A close-up of the three series since just before the pandemic hit shows the pattern, discussed below, even better: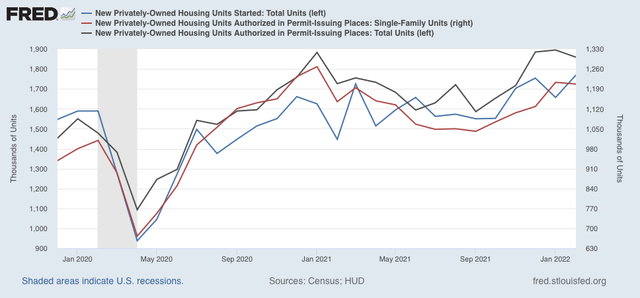
As you can see, there was a surge in permits one year ago, which then declined sharply. In January total permits rose again, to 1.895 million annualized, the highest number since 2006, before falling back slightly in February to 1.859 million. Single family permits also declined slightly to 1.207 million, vs. January 2021’s high of 1.268 million. Starts, by contrast, rose to 1.769 million, the highest monthly number, and highest 3 month average, since early 2006.
Since starts are the actual, hard economic activity, this indicates that housing is still a positive for the economy looking out ahead 12 months.
A big surge in housing permits in the face of rising mortgage rates, at least initially, is not really a surprise. The same thing happened several times in the past decade, notably in early 2014 and 2016, as potential buyers rush to close before rates climb even higher. Housing starts and single family permits (blue and red below, /10 for scale) does follow mortgage rates (inverted, gold), but with a 3 to 6 month lag as shown in the graph of the YoY% change in each for the past 10 years, which I have run many times in the past: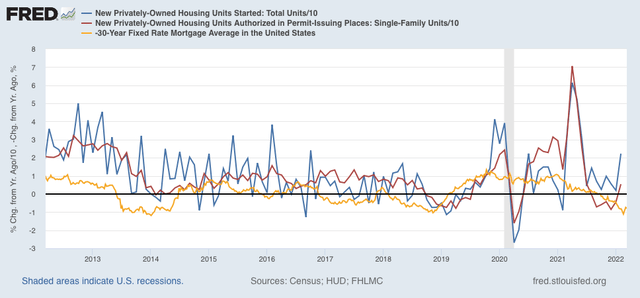
Last month I wrote that “after this surge, which may persist another month or so, I fully expect housing starts and permits to decline, and substantially, in accord with the big increase in mortgage rates to over 4%, about 1.3% above their 2021 lows.” The surge did persist, and I still expect a substantial decline in housing starts and permits in the months ahead. Some daily mortgage indexes already show rates around 4.5%. Much beyond that would likely put housing into a recessionary range later this year.