- by New Deal democrat
This morning’s report on January housing permits and starts highlighted the unique divergence between the two. As I have often pointed out, permits are the more leading and less noisy of the two reports, so I usually highlight them, especially single family permits.
But in the past year there has been a marked divergence in trend between the two data sets, as permits soared then sank, while starts have been much more steady. The explanation for the divergence is the huge number of housing units for which permits have been taken out, but on which construction has not started. In January that was 280,000 on a seasonally adjusted basis (red), the highest such number since non-seasonally adjusted records (blue) began in 1974:
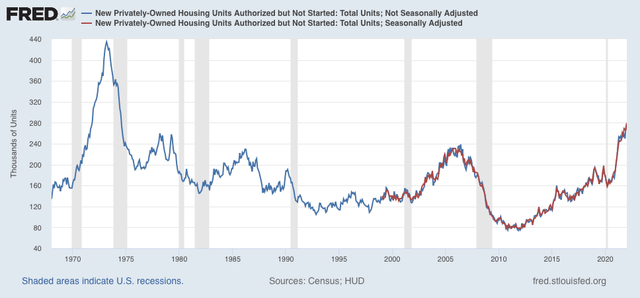
There are simply a huge number of units that *could* be started, but haven’t, probably because of a shortage of some necessary materials (I’ve heard, e.g., that windows are particularly in short supply).
With that in mind, below are total housing permits (blue), total starts (gray), and single family permits (red, right scale):
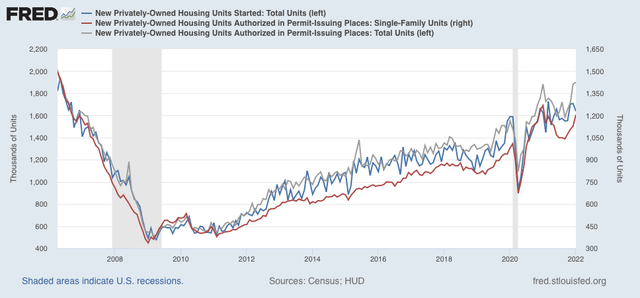
As you can see, there was a surge in permits one year ago, which then declined sharply. Total permits have risen again, to 1.899 million annualized, the highest number since September 2005. Single family permits also rose to 1.205 million, a one year high, but below January 2021’s high of 1.268 million.
Starts, on the other hand, declined to 1.638 million. I deal with that by averaging the last 3 months, which makes the number much less volatile. That average, 1.683 million, is the highest number since September 2006. A close-up of the three series since 2019 is below, better to show that actual starts have varied around 1.600 million in the past 12 months:
But in the past year there has been a marked divergence in trend between the two data sets, as permits soared then sank, while starts have been much more steady. The explanation for the divergence is the huge number of housing units for which permits have been taken out, but on which construction has not started. In January that was 280,000 on a seasonally adjusted basis (red), the highest such number since non-seasonally adjusted records (blue) began in 1974:
There are simply a huge number of units that *could* be started, but haven’t, probably because of a shortage of some necessary materials (I’ve heard, e.g., that windows are particularly in short supply).
With that in mind, below are total housing permits (blue), total starts (gray), and single family permits (red, right scale):
As you can see, there was a surge in permits one year ago, which then declined sharply. Total permits have risen again, to 1.899 million annualized, the highest number since September 2005. Single family permits also rose to 1.205 million, a one year high, but below January 2021’s high of 1.268 million.
Starts, on the other hand, declined to 1.638 million. I deal with that by averaging the last 3 months, which makes the number much less volatile. That average, 1.683 million, is the highest number since September 2006. A close-up of the three series since 2019 is below, better to show that actual starts have varied around 1.600 million in the past 12 months:
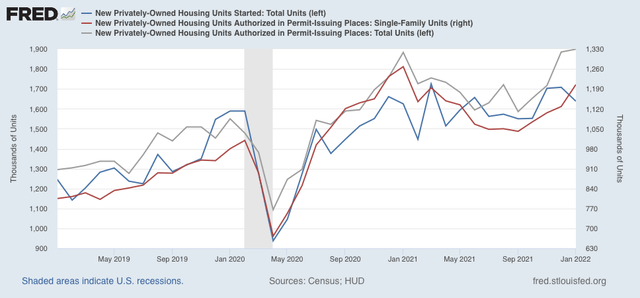
Since starts are the actual, hard economic activity, this indicates that housing is still a positive for the economy looking out ahead 12 months.
A big surge in housing permits in the face of rising mortgage rates, at least initially, is not really a surprise. The same thing happened several times in the past decade, notably in early 2014 and 2016, as potential buyers rush to close before rates climb even higher. Housing (blue and gray below, /10 for scale) does follow mortgage rates (red), but with a 3 to 6 month lag as shown in the graph of the YoY% change in each for the past 10 years, which I have run many times in the past:
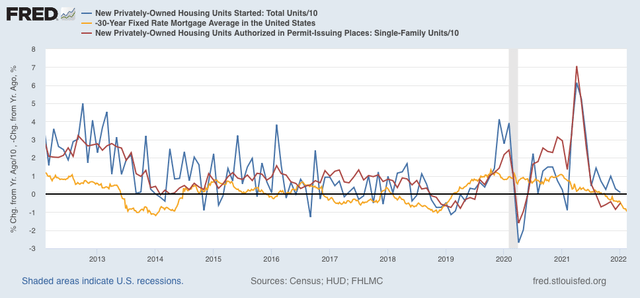
After this surge, which may persist another month or so, I fully expect housing starts and permits to decline, and substantially, in accord with the big increase in mortgage rates to over 4%, about 1.3% above their 2021 lows.