- by New Deal democrat
I want to make a comment about the value of measuring the number of coronavirus tests being administered vs. the number of cases found by those tests. This is because a few people are claiming that the ratio of positive tests to total tests does not give us value. Rather, they claim, increased testing simply reveals increased infections.
I will make a bold, unqualified claim: they’re wrong. Here’s why.
Empirically, about 6 weeks ago I looked at the South Korea data and realized that the peak was in once the percentage of positives to total tests started to decline. I suggested tracking that to Bill McBride, who has since included it in his daily testing updates. It turns out this ratio has a name in the epidemiological literature (which, sorry, I’ve forgotten), and is regarded as a useful “second-best” type of measurement.
Imagine we are tasked with finding out whether there is a constant ratio of red M&M’s vs. the entire batch produced. We are asked to figure out if the ratio is the same, or if the number of red M&M’s is increasing or decreasing.
There are 1000 M&M’s in a batch. We can only sample 100 of them. So we pull 100 at random every day, and count the number of red M&M’s in our sample. Depending on whether the number of red M&M’s in our sample is increasing, decreasing, or staying the same, we conclude that the total number of red M&M’s in the entire batch is likewise increasing, decreasing, or staying the same.
While any given sample might be off, over the longer term our conclusion is almost certainly correct. What’s more, even if our sample turns out not to be random, but is non-random *in the same way* each day, our conclusion is probably still accurate, because the error in our calculations always goes in the same direction. Thus the day/day progression is still true.
That’s what we’re seeing in coronavirus testing. We have certainly not been testing enough. But what we didn’t see was an increasing percentage of positives compared with the more or less stalled number of total tests during the first three weeks of this month. To go back to our analogy, during the first three months of April we found a similar number of red M&M’s every day in our similar sized samples.
That tells me that the incidence of coronavirus infections was not increasing during that time.
In the last few days, as shown in the below graph, the number of tests administered daily has increased. So has the number of infections found:
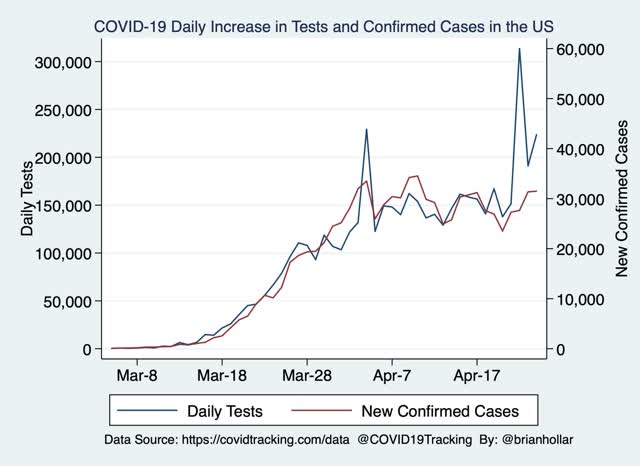
But the rate of increase has not been the same - far from it.
The above graph ends with April 24. Here’s what the number of new daily infections including April 25 looks like:
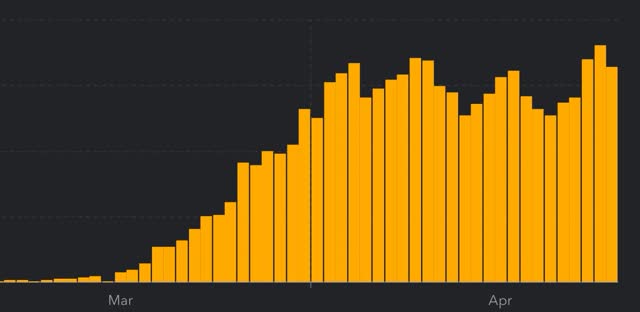
Now look at the first three-day peak from about three weeks ago (specifically, April 2-4). During that 3 day period, a total of 94,912 new infections were diagnosed vs. 103,735 in the past 3 days (April 23-25). That’s an increase of 9.3%.
Now let’s compare the number of tests administered over those same 3 day intervals. During the 3 day period of April 2-4, 484,256 tests were administered. During April 23-25, 717,079 tests were administered. That’s an increase of 48.1%.
So we administered 48.1% more tests, and only found 9.3% more infections. In other words, the number of recorded infections probably only increased because we had the increased ability to find them. That simply does not support any conclusion that the number of infections is increasing. The number of new daily infections is either staying the same, and, more likely, is decreasing — because we found infections in only 14.5% of the tests we administered in the past 3 days vs. 19.6% of tests administered during April 2-4.
That’s the significant open issue: are new daily infections actually declining, albeit at far too slow a rate, or are they just staying at a plateau? My suspicion is, because the rate of increase in infections found was so small compared with the big increase in testing, that the former situation, i.e., a slow decline from peak, is the truth.