- by New Deal democrat
Here is my weekly update on the 2020 elections, based on State rather than national polling in the past 30 days, since that directly reflects what is likely to happen in the Electoral College. Remember that polls are really only nowcasts, not forecasts. There is nothing inherent in their current status which tells you they will remain in the same category in early November.
Which brings me to the matter of Nate Silver, who unveiled his “forecast” this past week.
Which brings me to the matter of Nate Silver, who unveiled his “forecast” this past week.
Here are the two problems: (1) it is not falsifiable; and (2) it’s *not* a forecast! At best it is a forecast of what he currently expects his nowcast to be on Election Day.
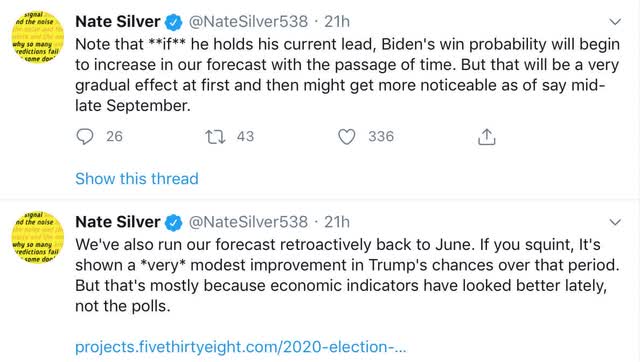
Here are a few of his tweets that demonstrate the problem:


Ultimately, Nate says that his “forecast” *currently* gives Trump at 27% chance of winning, and Biden a 72% chance of winning.
Suppose Biden wins narrowly. Or solidly. Or has the biggest victory since 1932? In all of those cases, Silver will say his model was correct. But supppose to the contrary that Trump wins. In that event, Silver will *also* say his model was correct! About the only thing Silver appears to rule out is a Trump blowout. In every other scenario, he will say his model was correct.
It’s simply not falsifiable, and so ultimately not scientific.
Further, as Nate says above, his model is going to change with the news and the polling between now and Election Day. But a “forecast” that keeps on changing right up until Election Day is really only a nowcast.
By contrast, economic models based on leading indicators can give a forecast that is “locked in” well before Election Day. And with the exception of the model based on personal income, as to which I am waiting for July’s numbers in two weeks, they all forecast a Biden win, albeit by a percentage that is less than most of his polling advantage presently.
As an aside, note that in the three biggest blowouts of the past 100 years - 1932, 1964, and 1984 - the loser got 40%, 39%, and 41% of the vote, respectively. So even though Trump is polling in the low 40’s, with very few undecideds, by historical standards it is a very poor sign for him.
With that said, let’s turn to this week’s poll numbers.
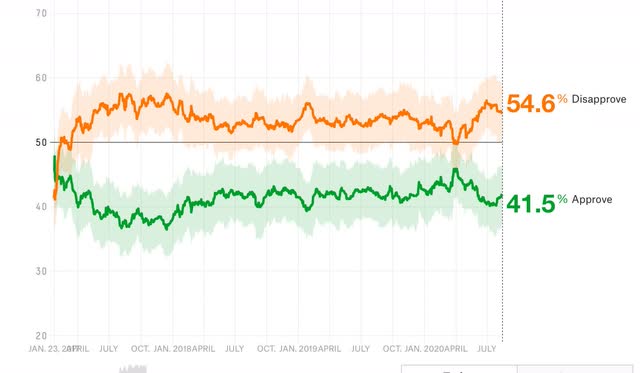
Last week I noted that Trump’s approval was reverting to the mean, as were the Presidential polls. The former trend has stalled; the latter has shifted slightly further in Biden’s favor.
Here is Nate Silver’s Trump approval vs. disapproval graph:

After languishing at 40%, equivalent to the worst levels of his Presidency, Trump’s partisans came back to supporting him again, as they always have for the past four years. Will his transparent trashing of the Postal Service in order to thwart voting by mail cause another temporary erosion of support? Too soon to tell.
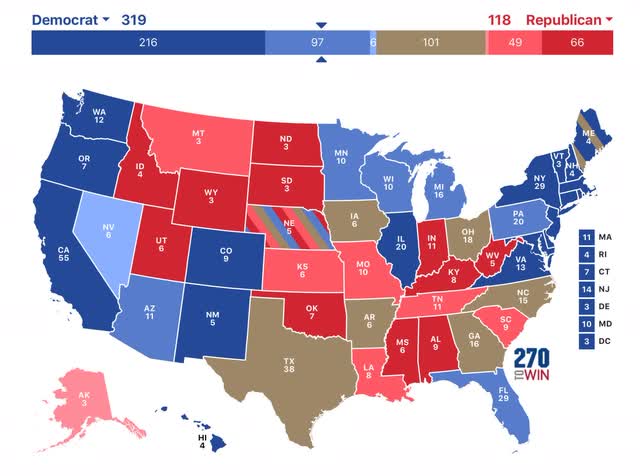
In any event, here below is the updated map through August 15. To refresh, here is how it works:
- States where the race is closer than 3% are shown as toss-ups.
- States where the range is between 3% to 5% are light colors.
- States where the range is between 5% and 10% are medium colors.
- States where the candidate is leading by 10% plus are dark colors.

There were very few changes this week. New polling moves Arizona from “lean” to “likely” Biden. North Carolina and the State of Nebraska at large both move back from “lean Trump” to “toss-up.” On the other hand, Minnesota moves from “solid” to “likely Biden.”
Last week I noted that Trump’s approval was reverting to the mean, as were the Presidential polls. The former trend has stalled; the latter has shifted slightly further in Biden’s favor.
Here is Nate Silver’s Trump approval vs. disapproval graph:

After languishing at 40%, equivalent to the worst levels of his Presidency, Trump’s partisans came back to supporting him again, as they always have for the past four years. Will his transparent trashing of the Postal Service in order to thwart voting by mail cause another temporary erosion of support? Too soon to tell.
In any event, here below is the updated map through August 15. To refresh, here is how it works:
- States where the race is closer than 3% are shown as toss-ups.
- States where the range is between 3% to 5% are light colors.
- States where the range is between 5% and 10% are medium colors.
- States where the candidate is leading by 10% plus are dark colors.

There were very few changes this week. New polling moves Arizona from “lean” to “likely” Biden. North Carolina and the State of Nebraska at large both move back from “lean Trump” to “toss-up.” On the other hand, Minnesota moves from “solid” to “likely Biden.”
Further, despite heavy polling, Georgia, North Carolina, Ohio, and even Texas remain in the toss-up category - and Florida remains firmly in the “likely Biden” category.
There are a few States where I have had to rely on older polling, and really need to be updated, notably Nevada, Arkansas, and West Virginia.
Once again, based on the current map Biden just has to win the “solid” and “likely” States, and need not win any of the “lean Biden” States, in order to win the election.
I continue to be of the opinion that Trump has 3 weeks left - until Labor Day - to work a miracle with the coronavirus pandemic. If it is about where it is now, then the economic fundamentals + the casualties from the pandemic indicate that Biden will win the popular vote in November, although the race seems likely to tighten somewhat, because the short leading economic indicators have been suggesting the economy will improve somewhat.
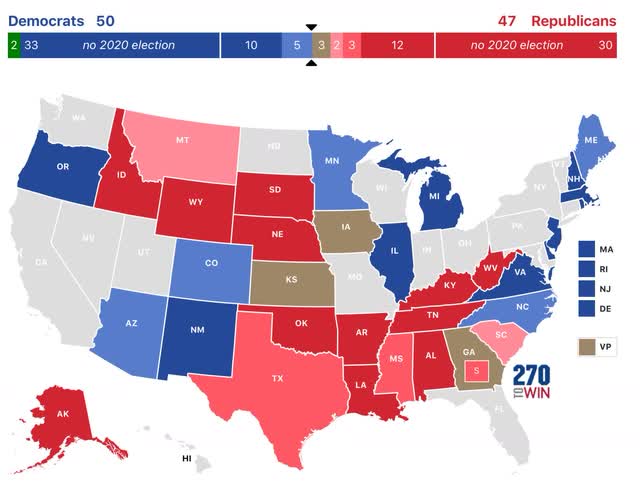
The solidifying of the Presidential election map is having a continued effect on polling for Senate races, as shown in the below map which uses the same % cutoffs as for the Presidential map:

There have been a number important changes in the past two weeks. Four favor Democrats: Maine moves back from “toss-up” to “likely Democrat,” the Georgia Senate seat Ossoff is running for moves from “lean Republican” to “toss-up,” Texas moves from “solid” to “likely Republican”, and and South Carolina moves from “likely” to “leans Republican.” On the other hand, two changes favor Republicans: Alaska moves from “likely Republican” to “solid Republican,” and Montana moves from “toss-up” to “leans Republican.”
Based on this map, even if they do not win any of the “toss-up” States, but just win those rated “likely and solid,” Democrats will wind up with 50 Senate seats and so a technical majority. If they were to win the “toss-ups” and “lean Republican” races as well, they could wind up with as many as 55 Senate seats.
I do suspect that Senate races will closely mirror Presidential vote totals in the States this year, as voter preferences are deeply entrenched.