- by New Deal democrat
One of the consistent things I have written about the housing market for going on 10 years is that interest rates lead sales, and sales in turn lead prices. Last week with the continued increase in housing starts and permits we got further proof of the former, and this morning with the release of several house price indexes, we got further proof of the latter.
Below I show the FHFA house price index (blue), Case Shiller national house price index (green), and housing permits (red, /4 for scale). Because prices are seasonal, I show all of these metrics YoY:
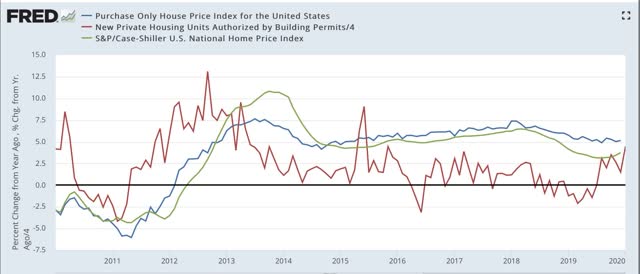
The trough for permits YoY was last March. The trough for both the FHFA and the Case Shiller indexes was last August. The YoY change increased m/m for the FHFA from 4.9% to 5.1% in December. For the Case Shiller national index the YoY rate of change increased from 3.5% to 3.8%.
Although median household income is the best measure, since it is not available m/m from government sources, as a proxy the below compares average weekly earnings for non-supervisory households (gold) with both the FHFA and Case Shiller indexes:
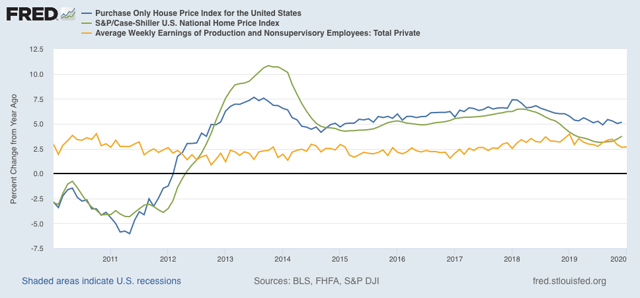
Earnings have not kept pace with house price increases. What is undergirding the upswing in housing sales is the steep decline in interest rates since the end of 2018.