- by New Deal democrat
I’m still on vacation, so continue to expect light posting. But I thought I’d take a look at the one piece of data that came out this week, the June JOLTS report.
First of all, the “hiring leads firing” mantra continues to be true:
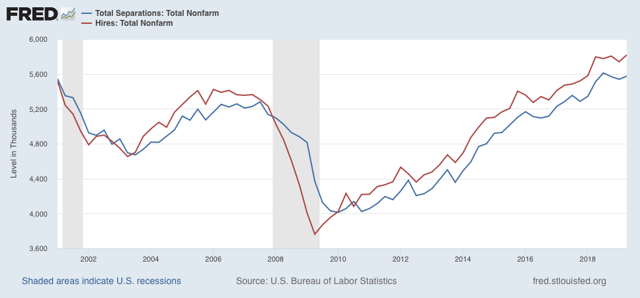
[Note: data averaged quarterly to cut down on noise.] Interesting that hiring has been essentially flat for a full year, and total separations (“firing”) for the past three quarters.
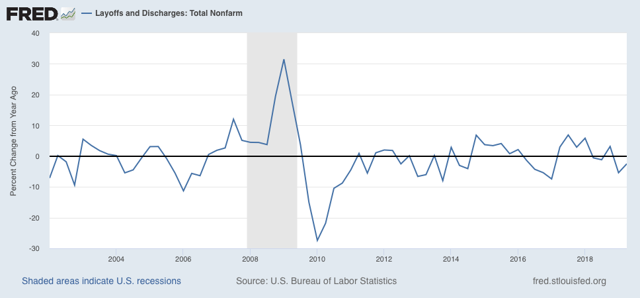
But the layoffs and discharges part of separations continues down YoY, a good thing, and what initial jobless claims and the unemployment rate also show, if weakly:
But the relative weakness of the employment situation show up in the YoY% changes in hiring, voluntary quits, and job openings (all normed to zero at their current levels in the below graph):
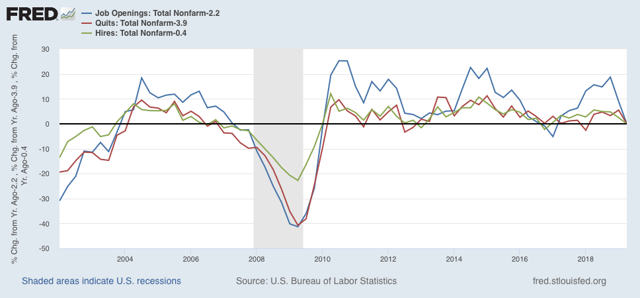
Note that the changes aren’t as bad as during the 2015-16 shallow industrial recession, or immediately before the 2007 recession (they’re more like 2006 levels).
I thought I’d extend Monday’s graph of monthly manufacturing, residential construction, and temporary job changes back through the weak 2015-16 period and compare that as well:
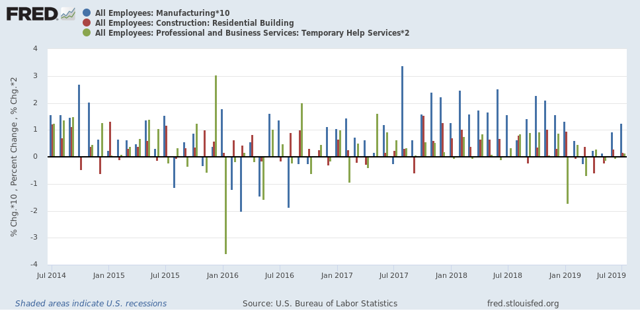
The “shallow industrial recession” featured more negative manufacturing and temporary jobs months than this year so far.
Again, the takeaway is weakness, but no imminent downturn.