- by New Deal democrat
The jobs report one month ago was poor, so as expected the JOLTS report for May, released this morning, followed suit.
To review, because this series is only 20 years old, we only have one full business cycle to compare. During the 2000s expansion:
- Hires peaked first, from December 2004 through September 2005
- Quits peaked next, in September 2005
- Layoffs and Discharges peaked next, from October 2005 through September 2006
- Openings peaked last, in April 2007
as shown in the below graph (normed to 100 as of May 2018):
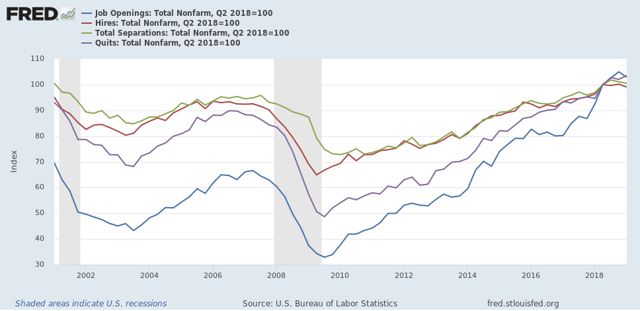
As shown above, in today’s report, all of the above series, as well as job openings, declined month over month. Additionally, the only series that were higher compared with one year ago were job openings (+2.8% but significantly off its November 2018 high) and quits (+2.5%)
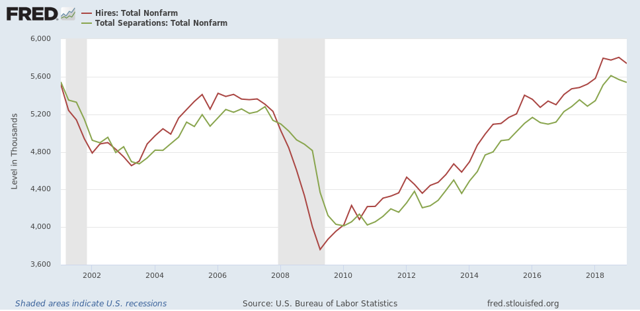
Next, here is the history of the “hiring leads firing” (actually, total separations) metric, measured quarterly to cut down on noise):
And here is the monthly measure for the last five years (plus job openings in blue):
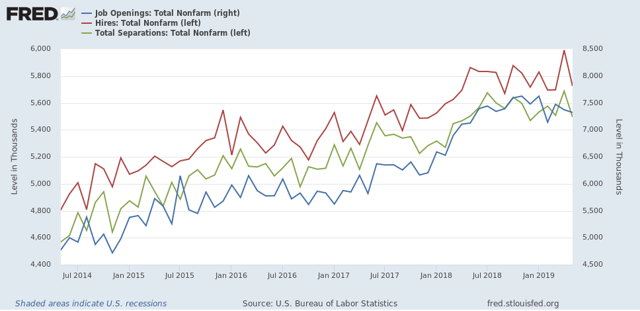
As you can see, both hires and fires have essentially gone sideways for the last twelve months. It is possible both are at a turning point, but it is impossible to know.
Only layoffs and discharges have shown an improving trend over the last year, and ticked lower in May, although they are off their best readings:
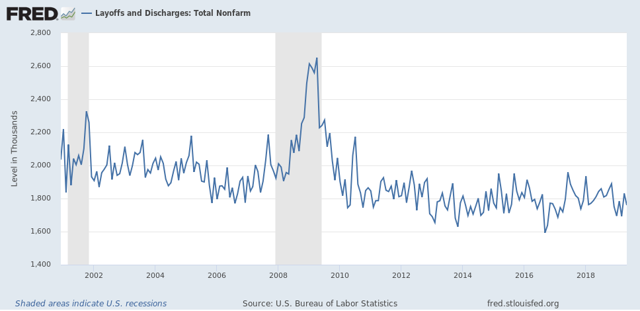
To sum up, job openings have declined about -4% from their peak six months ago. Hires, quits, and total separations have been rangebound, with the only improvement in layoffs and discharges.
While the absolute levels are solid, this month’s report, just like last month’s jobs report, does not show an improving jobs market. But since the June jobs report was strong, we can expect the JOLTS report next month to be stronger as well.