- by New Deal democrat
Last Friday, following the release of May’s personal income and spending report, Prof. Jared Bernstein, whom I follow religiously, wrote among other things about some economic headwinds and tailwinds, including the following:
Finally, my personal favorite tailwind indicator [pointing to the below graph]: the close tracking between aggregate real earnings and consumer spending. The good news is they’re both clearly in expansion territory. The bad news is that they can both downshift within a few quarters:
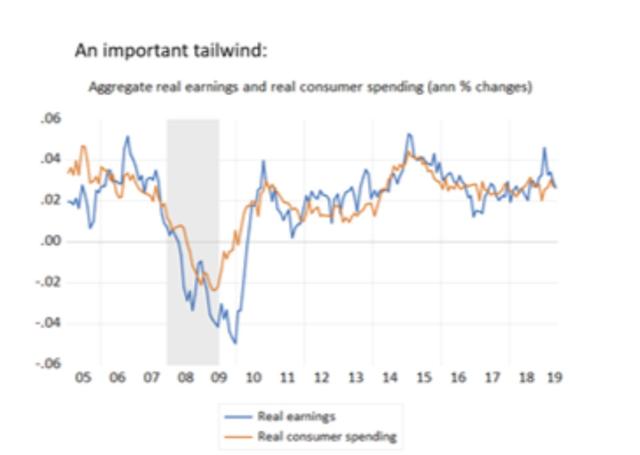
Although he labels them differently, the first is one of my favorites as well: real aggregate payrolls of production and non-supervisory employees. The second is real personal consumption expenditures.
That piqued my interest, because over seven years ago I wrote that
real retail sales are much more volatile [than personal consumption expenditures]. And, . . . in a very specific and non-random way
early in economic expansions, YoY real retail sales growth far outstrips YoY PCE growth. As the economy wanes into contraction, YoY real retail sales grow less and ultimately contract more than YoY PCE's. You can see that by noting that retail sales minus PCE's are always negative BEFORE the economy ever tips into recession [graph omitted]. That's 11 of 11 times. Further, in 10 of those 11 times (1957 being the noteworthy exception), the number was not just negative, but was continuing to decline for a significant period before we tipped into recession.
So normal is this pattern that it is one of my “mid-cycle indicators.”
Okay, to the nitpick....
Prof. Bernstein’s post suggests that real personal consumption expenditures and real aggregate wages are coincident to one another. Since both are OK now, that’s a significant tailwind.
But what happens when we substitute real retail sales?
Let’s start with real personal consumption expenditures and real retail sales, going back 60 years (averaged quarterly to cut down on noise):
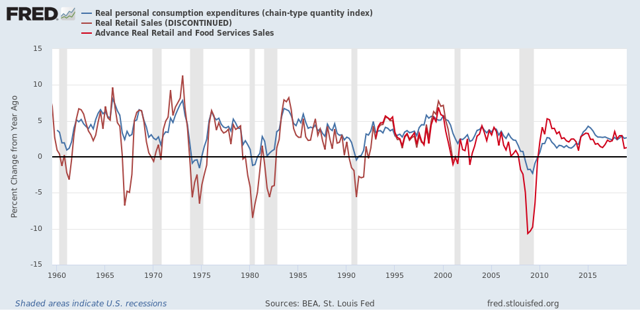
This graph confirms that (1) real retail sales more often than not slightly lead real personal consumption expenditures, and (2) real retail sales are much more volatile, especially to the downside, meaning they especially lead in the months leading up to a recession. Hence the “non-random way” in which the two measures differ.
Here’s the monthly comparison over the past five years:
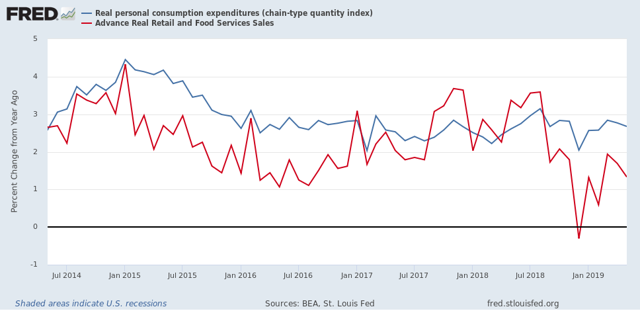
After a resurgence following the 2017 hurricanes, YoY growth in real retail sales has fallen well below that of real personal consumption expenditures, including one negative month during the government shutdown “mini-recession.”
So, now let’s compare real aggregate payrolls to real retail sales. Here’s the long term look going back 55 years to the start of the series:
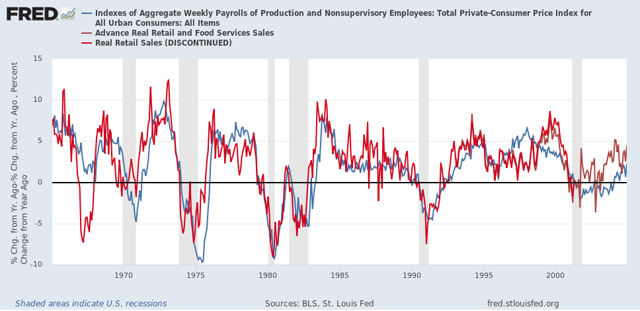
And here is the past 15 years (the same time frame as Prof. Bernstein’s graph):
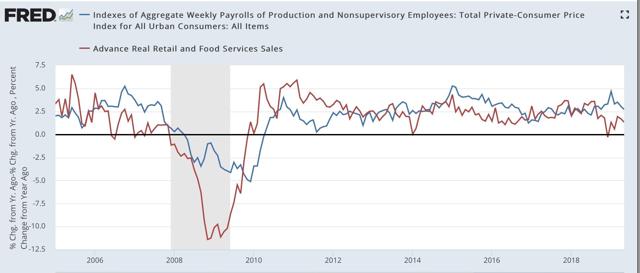
With the exception of 1980, real retail sales have always improved first coming out of recessions. Further, more often than not (1969, 1981, 2000, 2007) real retail sales have also led real aggregate payrolls heading into recessions.
As shown in the last graph above, so far this year looks a lot like 2006. That doesn’t mean there can’t be a bounce, but what it does suggest is that consumer behavior isn’t nearly as much of a tailwind as Prof. Bernstein’s statement would make it appear.