- by New Deal democrat
One item I didn’t get around to in the last couple of weeks is how wages performed as of January’s jobs report. And the basic answer is: pretty good!
The first graph below shows real, inflation adjusted average wage gains for non-managerial workers measured YoY:
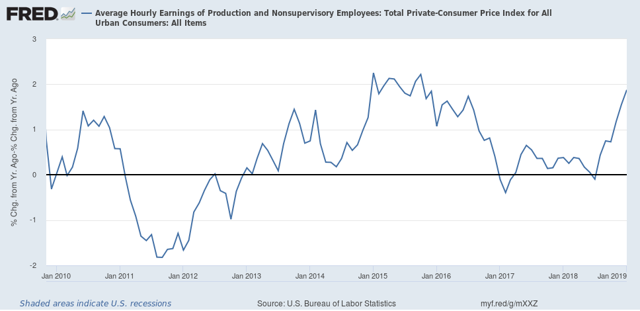
The first graph below shows real, inflation adjusted average wage gains for non-managerial workers measured YoY:
As of January they were up +1.9%. This is the best showing except for a few months in 2015.
As Jared Bernstein has shown, the “real” gains in wages have a lot to do with the price of gas (blue in the graph below). But in the last two months they have risen the most in the last 8 years in real terms ex-energy:
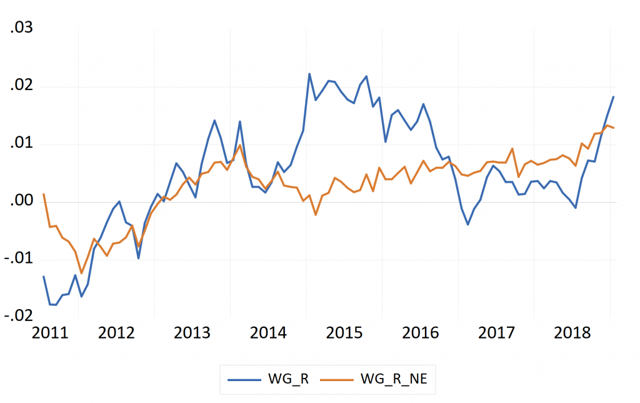
So average workers are finally making some real headway.
By the way, this also shows up in the Q4 2018 Employment Cost Index that was released three weeks ago:
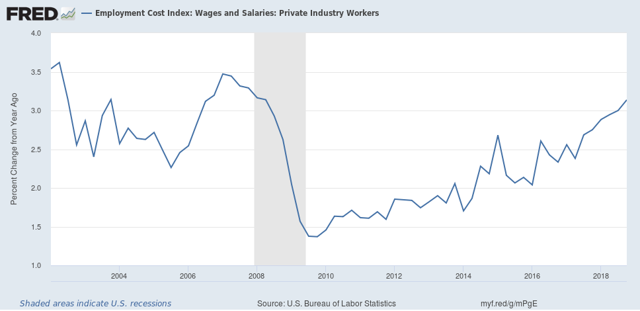
By the way, this also shows up in the Q4 2018 Employment Cost Index that was released three weeks ago:
The ECI measures *median* wages, i.e., the 50th percentile level, and so does away with the “Bill Gates enters a bar” problem. At +3.1% YoY, this is the best showing since late 2006-early 2008.
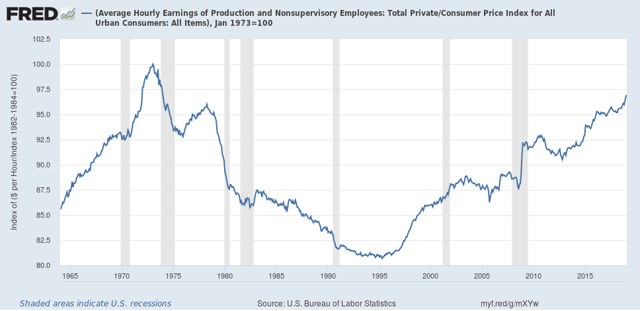
Returning to real inflation adjusted average wages, they improved again and are now only 3% below their 1973 peak:
Finally, total wage growth for non-managerial workers since the bottom in October 2009 is now up +28.5%:
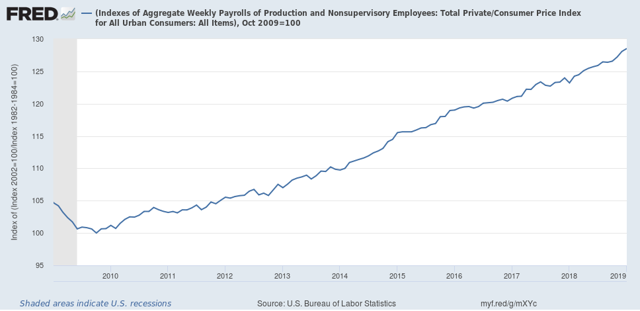 Total wage growth from this entire expansion has only been exceeded by the 1960s and 1990s expansion. The bad news, of course, is that it took 9 years to get here.
Returning to real inflation adjusted average wages, they improved again and are now only 3% below their 1973 peak:
Finally, total wage growth for non-managerial workers since the bottom in October 2009 is now up +28.5%: