- by New Deal democrat
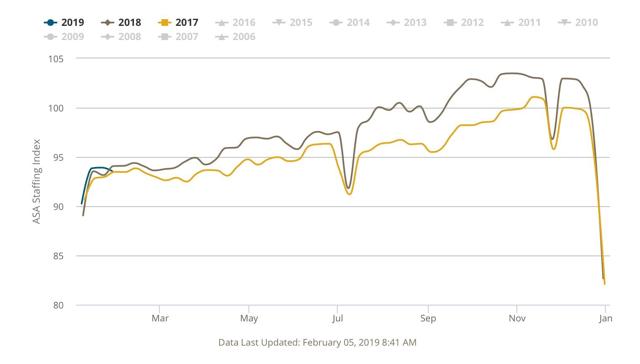
Every week I report the YoY 4 week rolling average of American Staffing Association’s Index. It’s been decelerating recently, and last week was up only +0.5% YoY. On a single week basis, though, it went negative.
Because I have written several posts in the last couple of months emphasizing the leading aspect of temporary jobs in the monthly employment report, I thought I would compare the Staffing Index against it.
Here’s what I found: since the Staffing Index isn’t seasonally adjusted, you really have to compare each on a YoY basis. And while the two don’t turn positive or negative at the same time or for the same duration, they do correlate well on YoY direction; i.e., acceleration or deceleration in the YoY comparison.
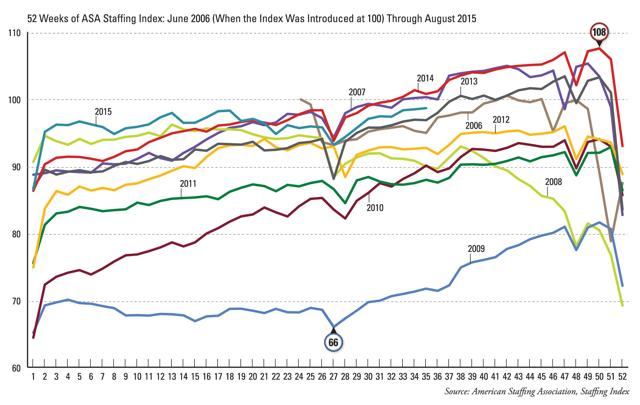
The Staffing Index only began to be published in 2004. Since then, there have only been two periods when staffing turned negative YoY: the Great Recession and the 2015-16 energy patch downturn.
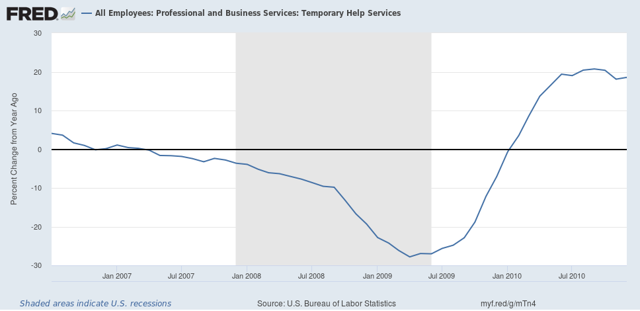
As the first two graphs below show, at the time of the Staffing Index lagged the monthly jobs report by half a year in 2007, and led it by one month at the end of 2009:
Because I have written several posts in the last couple of months emphasizing the leading aspect of temporary jobs in the monthly employment report, I thought I would compare the Staffing Index against it.
Here’s what I found: since the Staffing Index isn’t seasonally adjusted, you really have to compare each on a YoY basis. And while the two don’t turn positive or negative at the same time or for the same duration, they do correlate well on YoY direction; i.e., acceleration or deceleration in the YoY comparison.
The Staffing Index only began to be published in 2004. Since then, there have only been two periods when staffing turned negative YoY: the Great Recession and the 2015-16 energy patch downturn.
As the first two graphs below show, at the time of the Staffing Index lagged the monthly jobs report by half a year in 2007, and led it by one month at the end of 2009:
At the time of the energy patch downturn, the Index turned negative YoY in May 2015:
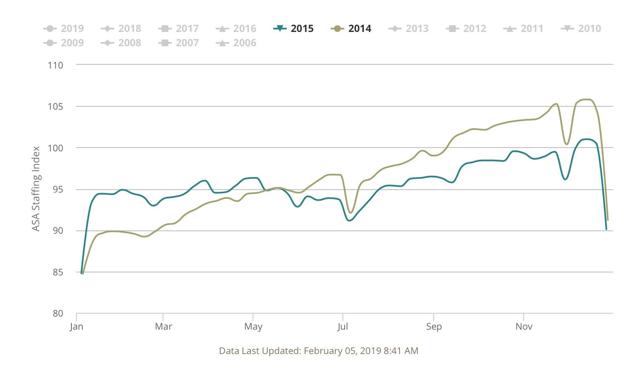
And continued negative until June 2017:
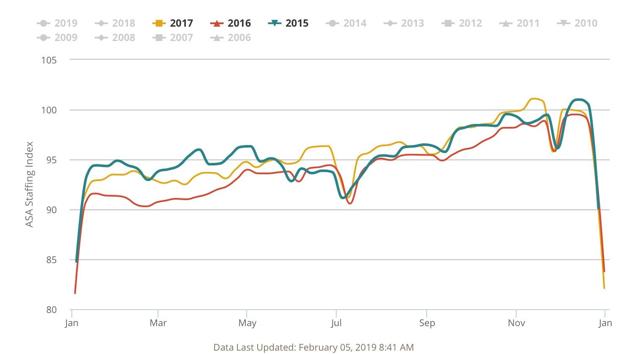
Meanwhile,monthly temp jobs number did not turn negative except most of the last 9 months of 2016 — although it started its rapid deceleration almost exactly when the Index went negative:
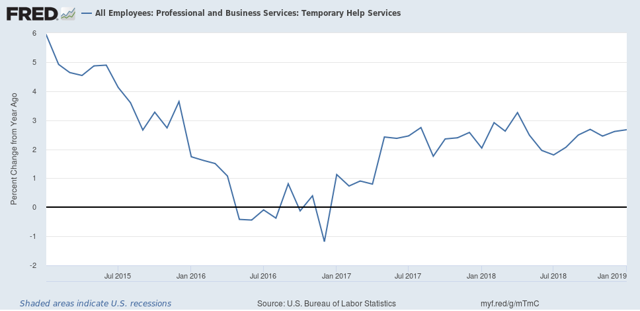
Note that decelation in the YoY number corresponded with the Staffing Index’s turning negative in 2015, and continued to improve until mid-2017.
Most recently, the YoY comparisons started to deteriorate in the Staffing Index in November, and have been barely positive so far this year.
All of which makes me think that the deceleration of temp jobs in the monthly report for the last three months, as shown in the final graph below:
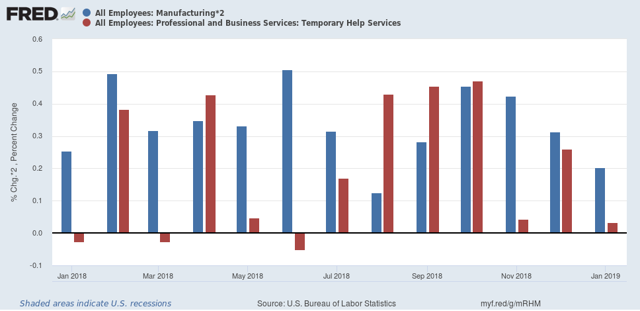
hasn’t just been noise, but - while still positive - is demonstrative of real weakness.