Let's start with the gold ETF, because I find this chart really interesting right now. First, the price/EMA situation is very bullish. prices are in a clear upward sloping channel and the EMA picture is about as bullish as you can get. But notice that prices have found a tremendous amount of resistance in the 122/123 area. They have tried to move through that are three times, only to be rebuffed. Then look at the technical picture -- the MACD is dropping as prices rise (c) the A/D line printed a lower high on the second set of tops (d) and the CMF is dropping. All of these say that prices are getting weaker, despite what the chart says.

On the daily chart, notice the severity of the price drop (a) after price made a new high.
All of these factors lead me to seriously wonder about the strength of Gold's rally. What we need is a convincing move through the 122/123 area on really good volume.

Yesterday, the markets gapped higher at the open (a), but then moved lower for most of the day (b). Once prices crossed support in the late afternoon (e) they moved lower (c) on very high volume (d).

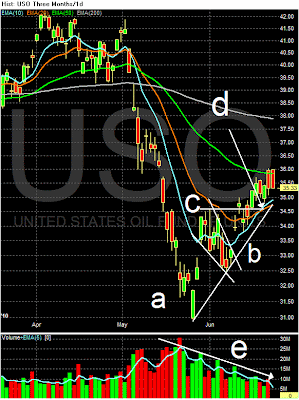
Oil is still in an uptrend (b) that started after the high volume bottom (a). We've seen prices consolidated (c) along the way along with an important EMA crossover -- with the 10 crossing over the 20 a few days ago (d). However, notice the decreasing volume of the rally (e).

However, oil's rally has been anything but clean. In fact, it has been extremely fractured. Notice there are three distinct upward trends. The first (a) has two gaps higher. On the second (b) prices are again extremely volatile. For the last three days prices have been consolidating in a narrower area (c). But the overall image is hardly clean in any way shape or form.

And finally, yesterday we see that the 7-10 year area of the Treasury curve moved lower, through the trend line, but rallied throughout the day to hit a higher price.