- by New Deal democrat
This morning's preliminary reading of Q1 2018 GDP at +2.3%, down from the previous quarter's +2.9%, was generally in line with forecasts. As usual, my attention is focused less on where we *are* than where we *will be* in the months and quarters ahead.
There are two leading components of the GDP report: real private residential investment and corporate profits. Because the latter will not be released until the second or third revision of the report, I make use of proprietors' income as a more timely if less reliable placeholder.
So let's take a look at each.
Real private residential fixed investment was flat (blue). Measured by the more precise method of its share of the GDP as a whole (red), residential investment actually declined:
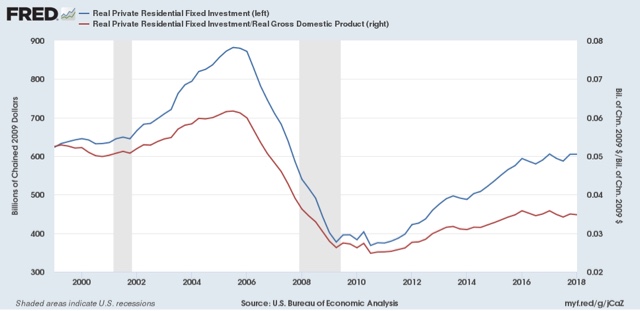
According to Prof. Edward Leamer, this typically peaks about 7 quarters before the onset of a recession. As it has not made a new high since four quarters ago, and must be considered a signficant leading indicator of recession at this point.
Proprietors' income, on the other hand, rose again in the first quarter. The below graph compares it with the less timely but more accurate corporate profits:

Remember that the big decline in corporate profits in Q4 of last year had to do with accounting for repatriation of overseas earnings in the recent tax bill, so right now proprietors income is probably giving us the more accurate, positive, signal.
While the economy is very likely to continue to grow through 2018, together this most recent data suggests a more questionable picture heading in 2019. In particular, this is the first important housing metric to roll over to negative.
This confirms a note I made when discussing Q4 2017 GDP three months ago, At that time I indicated that I wasn't expecting any big positive breakout. This goes back to the relative flatness or restrained growth in housing. The below two graphs show the leading relationship between housing permits (using the less volatile single family measure) and GDP broken up into two roughly 30 year periods:


Since the YoY% change in permits for 2015-17 was roughly 10% (divided by 4 for purposes of scale in the above graphs shows a number of ~2.5%), I wrote that a continued roughly 2.5% YoY growth of GDP for the next few quarters is a reasonable projection.
One final very positive note: the employment cost index was also reported this morning, at a strong +0.8% q/q. It was up +2.7% YoY, the highest rate in almost 10 years:

[Note: I'll update with a better graph when available]
UPDATE: And, here's the better graph, showing the YoY% change for the life of the series:

There are two particularly good things about this: (1) it is a median metric; and (2) unlike other wage measures, it tracks pay for the same job over time. This tells us that the growth in pay for doing the same job has begun to rise significantly (UPDATE: and is clearly in an uptrend), a big plus in what has otherwise been a mediocre wage picture.