The IWMs (Russell 2000) continues to be the index to watch for "real" market sentiment.

The market has been consolidating since the Spring with a high in the upper 119s/lower 120s and low of 106s/107s. In addition, a prices are consolidating in a triangle pattern, with trend lines connecting the lows of May and the highs of July. The MACD his been trending lower since the July highs as well as has the RSI. We need to see a strong move above the 120 level or below the 106/107 level to get a better read on what this market really wants to do.
And so long as we're on the IWMS, let's take a look at important moves in the 5 minute weekly chart, comparing the SPYs and the IWMs.

The SPYs were in an uptrend all week. On several occasions they moved off the 200 minute EMA, using it as technical support. The 200 minute EMA was in an uptrend as well.
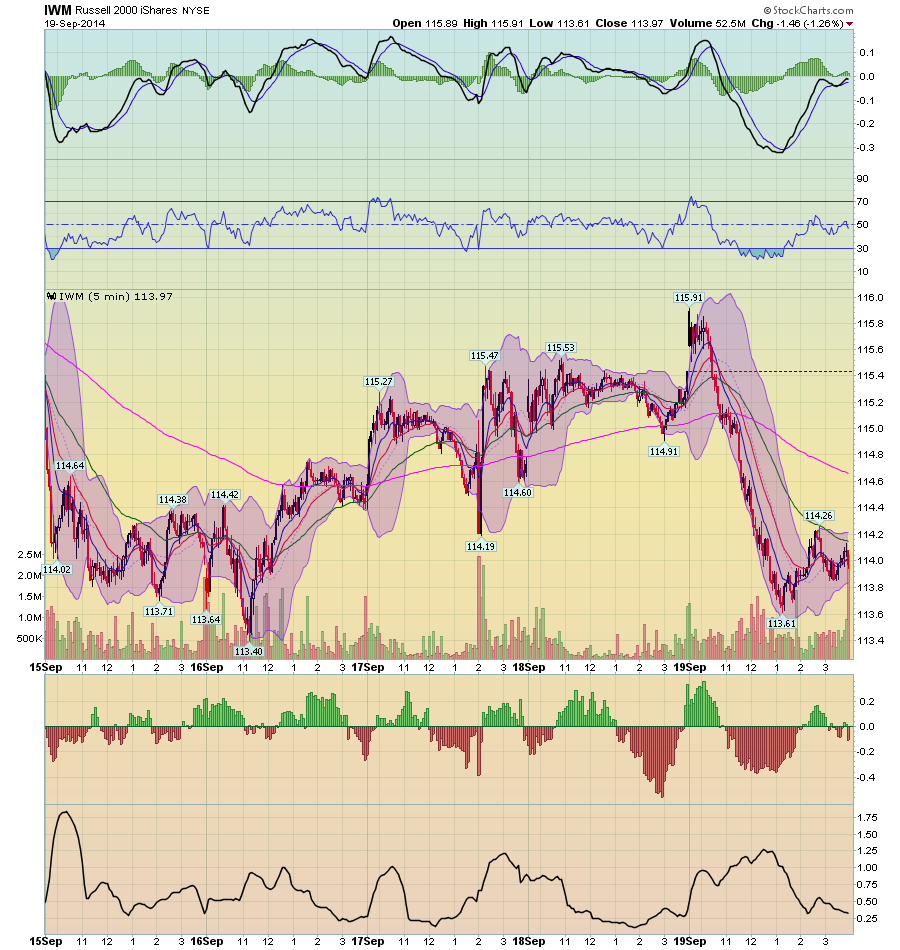
In contrast, note the sharp sell-off in the IWMs on Friday, and compare that to the SPYs sell off. The IWMs moved through the 200 minute EMA and continued lower until they were near the weekly lows. Only then did they rally. But the rally was only a bit stronger than a dead cat bounce, hitting resistance at the 50 minute EMA. And, the 200 minute EMA moved lower on Friday, in contrast to the SPYs.
Let's continue this comparison/contrast between the SPYs and IWMs by looking at the 30 day charts:

The 30 minute SPY chart can be broken down into two patterns, with the first being a price arc lasting for the first ~2/3 of the chart, as prices rose from the 197.25 level to the 200.6 level and then fell back to the lower 197s. But last week, in anticipation of the Fed's statement, the market rallied for the better part of the week. On Friday the market gapped higher, but then traded a bit lower.

Compare the SPY price chart to the IWMS, which have been in a downward trend printing lower lows and lower highs since the beginning of September. This is a pretty disciplined sell-off, meaning the bull/bear balance is only slightly balanced towards the bears. But it also indicates that risk appetite is weaker than we'd expect, especially if we're anticipating a stronger move higher.
Finally, let's look at the weekly SPY chart:

The overall annual uptrend is intact. Prices consolidated over the past few weeks, but moved through upside resistance on Thursday. The MACD is about to give a buy signal, and the RSI has room to move higher. This chart is pretty bullish. But remember the overall environment discussed above. The market is expensive and there is clearly a diminishing risk appetite that will hold back gains. Overall, we need more fundamentally bullish news such as corporate earnings growth, stronger employment numbers or overall GDP growth to keep moving consistently higher.