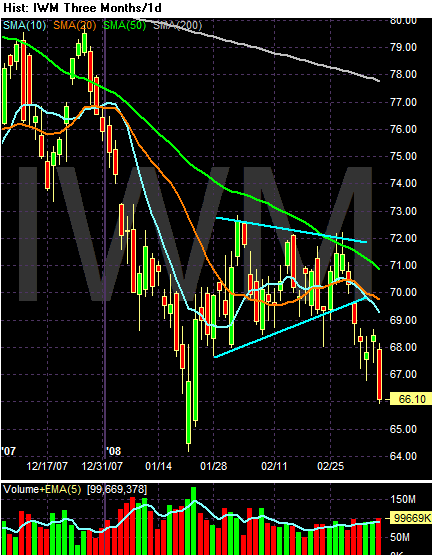
The Russell 2000 has continually led the way lower since the sell-off began in mid-summer. This makes sense. The Russell 2000 is comprised of small companies that don't pay dividends. Therefore, they need a growing economy to increase sales and thereby increase share price. But when the economy is shrinking, the exact opposite happens. So when traders think the economy is going to shrink, they start to sell the higher-risk stocks like those in the Russell 2000. As the chart shows, the index has been breaking lower for the last 4 days and today printed a long downward bar on high volume.
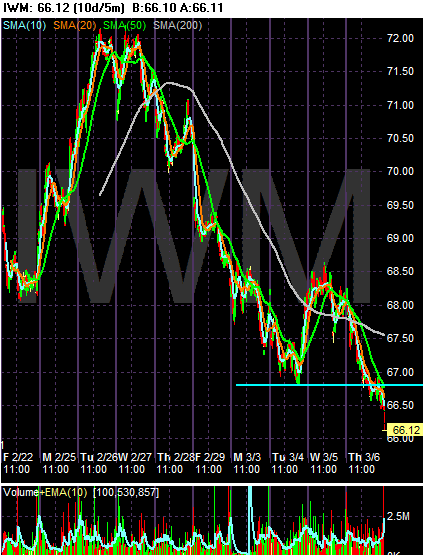
On the 10 day daily chart for the IWMs, note the index has not been able to maintain any upward momentum since last Wednesday. That's a whole lot of negative sentiment. Finally, notice the index broke down hard in the last bar on very heavy volume.
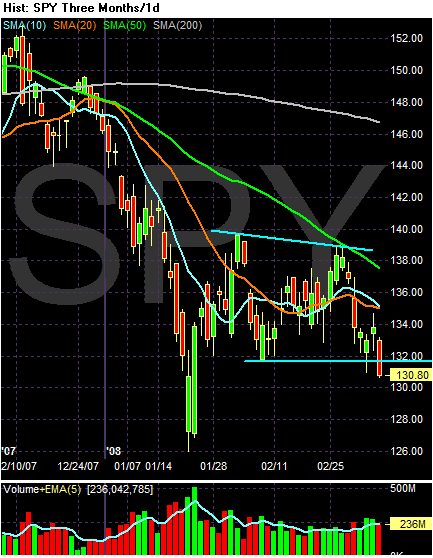
The SPYs also broke below support today. While the volume wasn't of the "break-out" variety, it wasn't weak either.
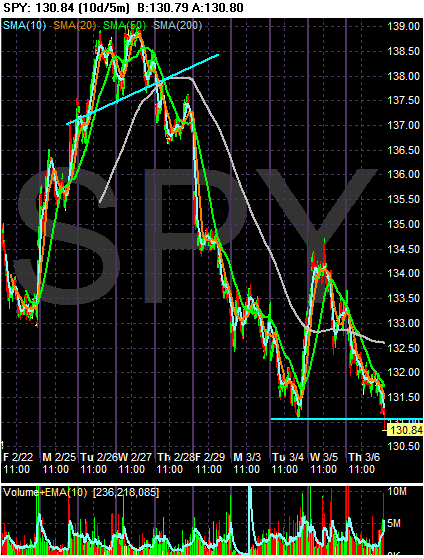
On the 10-day daily chart, notice that this SPYs have not been able to maintain any upward momentum and are currently at crucial technical support. Also note the high volume, last 5-minute bar today -- it's a big move lower.
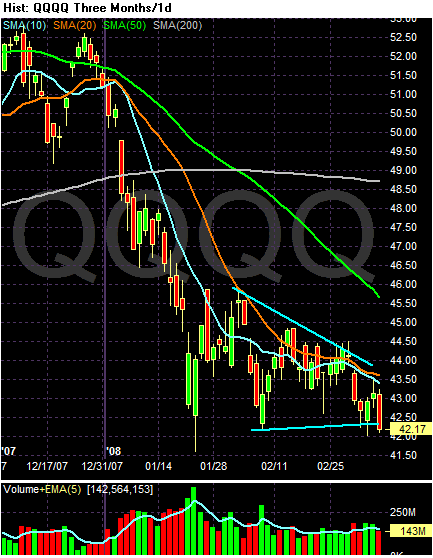
The QQQQs -- which have been consolidating in a triangle pattern -- are right at the verge of going lower.
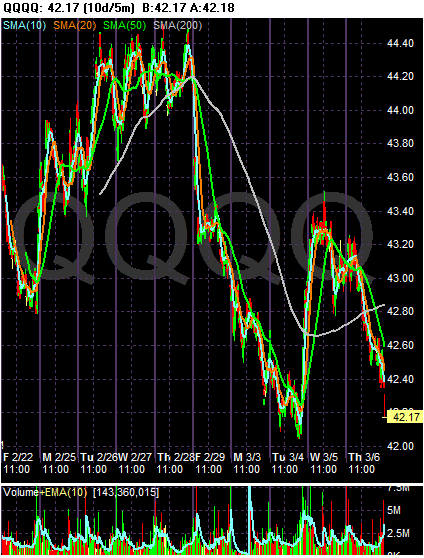
On the daily chart, notice we've got a bit to go before hitting crucial support levels. But there is a ton of negative sentiment in the market right now.