Saturday, April 23, 2022

Weekly Indicators for April 18 - 22 at Seeking Alpha


 - by New Deal democrat

My Weekly Indicators post is up at Seeking Alpha.

While I was writing about mortgage rates during the week, the yield curve did some re-tightening, enough to make a difference in the long term forecast.

As usual, clicking over and reading should help bring you up to the virtual minute as to the nowcast and forecast for the economy, and help me pay for some nice tapas the next time I dine out at a Spanish restaurant.

Friday, April 22, 2022

Mortgage rates continue to rise; once the backlog in construction is cleared, this will likely kill housing


 - by New Deal democrat

No important economic news today, but an important negative trend in interest rates is continuing. Mortgage rates are now at 12 year highs.


The weekly data from Freddy Mac’s weekly survey shows rates increased to 5.11% as of April 21:


This is 2.46% above the low of 2.65% that was set at the end of 2020, and the highest rates since April 2010. It is also only 1.69% below the 6.80% rate that killed the housing bubble in 2006.

And according to Mortgage News Daily, as of today rates have increased further to 5.38%.

Here’s an update of a graph I ran earlier this week, showing the YoY change in mortgage rates, inverted and *10 for scale, vs. the YoY% change in single family permits (red) and starts (gold):


Unless this situation reversed quickly, once the backlog in housing starts abates, this is going to absolutely kill the housing market.

Two very important long leading indicators are going to be updated next week: real money supply for March, and corporate profits (via proprietors’ income) for Q1. 

Stay tuned.

Thursday, April 21, 2022

Jobless claims: more 50+ year lows


 - by New Deal democrat

Initial jobless claims declined -2,000 to 184,000, another 50+ year low. The 4 week average rose 4,500 to 177,250, compared with the all-time low of 170,500 set two weeks ago. Continuing claims declined -58,000 this week to 1,417,000, a new 50 year low (but still well above their 1968 all-time low of 988,000):


Nobody  - still - is getting laid off. We’re still about 1.6 million shy of “full employment,” by my calculation. Further, the game of “musical chairs” whereby workers can always find higher wages somewhere is still very much happening. 

The next important marker is going to be “job openings” in the March JOLTS report which will be released next week. That’s because this situation is going to go on until enough employers decide that they simply can’t afford the higher wages demanded, or because increased prices have cooled off demand enough that they can get by without hiring more workers. 

Wednesday, April 20, 2022

Coronavirus dashboard for April 20: there’s a new subvariant in town


 - by New Deal democrat


Let me start with the current overview. As of today, Nationally cases are now rising sharply, up to 41,500, an increase of 25% in the past week:


Hospitalization are generally flat at slightly over 10,000, but new admissions have risen steadily, by 8% over the last 11 days:


Deaths have continued to decline, to 452, a level lower than all times during the pandemic except for 7 weeks last June and July:


But, conditions have changed.

Up until this week, my paradigm has been that cases in the US would follow the pattern in Europe, where once the BA.2 subvariant of Omicron reached roughly 90% of all cases, typically 2.5-3.5 weeks after the onset of the BA.2 wave, they peaked and then declined more or less rapidly.

Except . . . the Northeastern part of the US did not follow the pattern. Cases bottomed 5 weeks ago, starting in New York State, and have continued to rise ever since, and are now 2.6x the number they were at their trough:


The reason why the Northeast has been different from Europe, with cases continuing to rise for over a month, was first reported by the New York State Department of Health five days ago, in a press release that stated in relevant part:

The New York State Department of Health today announced the emergence of two Omicron subvariants in New York State, BA.2.12 and BA.2.12.1.... The subvariants have been estimated to have a 23% – 27% growth advantage above the original BA.2 variant. Over the past few weeks, the Department has been investigating higher than average infection rates in Central New York.... State health officials have determined that these highly contagious new variants are likely contributing to the rising cases. For the month of March, BA.2.12 and BA.2.12.1 rose to collectively comprise more than 70% prevalence in Central New York and more than 20% prevalence in the neighboring Finger Lakes region. Data for April indicate that levels in Central New York are now above 90%.”

In other words, here was a new subvariant with a 25% advantage even over BA.2, and displaced it almost entirely - by more than 90%! -  in the region where first reported within  just a few weeks.

The US had just become to BA.2.12.1 what South Africa was to the original Omicron, and Central NY was like South Africa’s Gauteng region, where BA.1 was first identified.

Yesterday the CDC updated their variant tracker, and for the first time included BA.2.12.1 as a separate subvariant. Here is their chart of variant proportions nationwide:


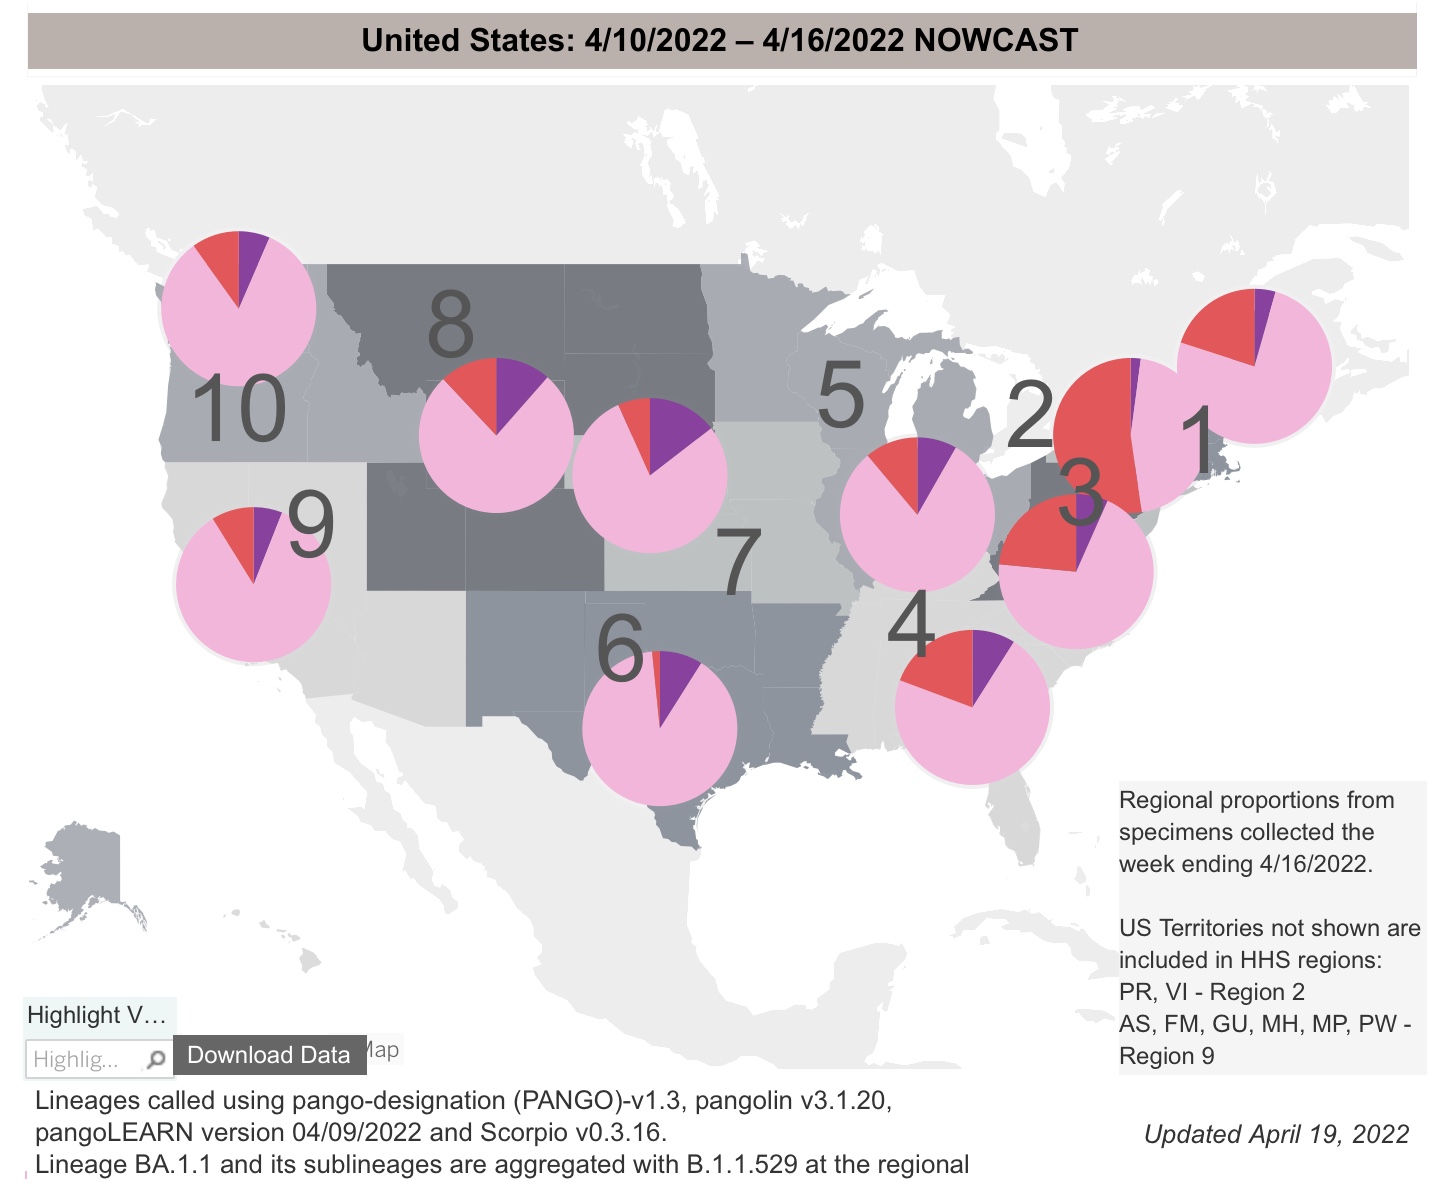
And here is the graph of the regional breakdowns:


Per the report, as of last week BA.2 and it’s subvariants constituted 93.4% of all US cases. BA.2.12.1 already constitutes 19% of all US cases (up from 3.3% just 3 weeks ago, and on a trajectory equal to that of the original BA.2). At its current rate of growth, BA.2.12.1 will be over 90% of cases in the US in just 5 weeks.

Regionally the BA.2 variants are 95% in the Northeast and over 90% along the West Coast. Further, BA.2.12.1 is already over half of all cases in NY and NJ:


Fortunately, Trevor Bedford, whose genetic work has been invaluable whenever new variants have appeared, weighed in yesterday after a three month silence. Here’s the most relevant portions of his thread:

 “Variant “fitness” will depend on intrinsic transmissibility and escape from existing population immunity…..  BA.2’s advantage over BA.1 appears to be due to intrinsic transmissibility…. [T]he one to watch just based on mutations is B.2.12.1 which has spike mutations S704L and L452Q on top of BA.2 background. Previously, L452R appeared to have an important role in promoting the spread of Delta and also showed up in Epsilon and Lambda…. The hypothesis is then that 452R/Q is conferring some additional intrinsic transmission advantage…. This sort of accumulation of mutations that drive further host adaptation and antigenic drift is my general expectation for evolution in the coming months. It’s possible we may have additional ‘Omicron-like’ events, but my baseline is this steady ‘flu-like’ scenario.”

In short, the template of Europe’s experience with BA.2 no longer holds for the US, because of the emergence of BA.2.12.1. The US itself is the new template.


Fortunately, we have the Northeast generally, NY and NJ more specifically, and even more specifically than that the counties of the Finger Lakes and Central regions of NY State as canaries in the coal mine.

In that regard, there is some good, or at least “less bad” news. While cases in both NY and NJ are still growing, the 7 day rate of growth in NY has decelerated from 45% one week ago to under 20%, and in NJ from 35% to 12%. It is even possible cases peaked in NJ several days ago:


Further, cases have peaked already in 8 of 14 counties in the Central and Finger Lakes regions of NY region. Here’s the graph of cases for the Central NY region, where cases bottomed on March 9, and rose to their peak on April 15, a little over 5 weeks later:


So here’s the paradigm going forward: using the “ground zero” regions of NYS as our new template, most likely cases will rise in each State until BA.2.12.1 reaches roughly 90% of all cases. We’ll get there in a couple of weeks in the Northeast, but only in about 2 months in the interior Deep South and Great Plains, where BA.2.12.1 is only about 3% of cases now. Nationwide cases began to rise 4 weeks after they did in Central New York, only two weeks ago. Thus the nationwide peak may come in about 3 to 5 weeks, by which time this new subvariant should be 90% of all cases. But in Central New York, cases tripled during their wave. A tripling of cases nationwide would be roughly 90,000.

Further, since organized public health strategies have all but disappeared in the US, the course of the pandemic will depend on the regularity of the emergence of more efficient strains. In the past 10 months, such new strains - Delta, Omicron BA.1, BA.2, and now BA.2.12.1 - have arisen about every three months. The only good news has been that the  death rate has continued to decline, as gradually the population as a whole develops a level of resistance due to vaccination and/or prior infection. 


Tuesday, April 19, 2022

Housing starts show continued strength in March, while single family permits indicate softness ahead


 - by New Deal democrat

The continued strength in total housing permits and starts shown in this morning’s report for March was surprising; but the series with the most signal and least noise, single family permits, betrayed weakness. 

While typically permits, especially single family permits, lead the series, in the past year, however, there has been a unique divergence between permits and starts, as supply shortages resulted in a delay in actually building houses that had been approved.

Housing authorized but not started increased to yet another 50+ year record last month, at 290,000: 


In 2021 permits soared then sank, while starts held much more steady, due to the above delay in the actual start of construction, as shown in the below graph of total housing starts (blue), total permits (gold), and single family permits (red, right scale) for the last 3 years:


A longer term look shows the continued growth in actual starts, while also showing underlying weakness in single family permits:


The three month average for starts is the highest since 2006. Note, by the way, that a similar thing happened several times in the past decade, notably in early 2014 and 2016, as potential buyers rush to close before rates climb even higher. 

Two months ago, I wrote that “after this surge, which may persist another month or so, I fully expect housing starts and permits to decline, and substantially, in accord with the big increase in mortgage rates to over 4%, about 1.3% above their 2021 lows.” In terms of starts, the surge has certainly persisted.

But this look at the YoY% change in starts (blue, averaged quarterly to cut down on noise) and single family starts (red), vs. the YoY change in mortgage rates (inverted, *10 for scale), shows that, while starts have held up, still 5% higher YoY, single family permits, now down -4% YoY, have not:


In the coming months, I still expect to see a substantial decline in permits. Ordinarily that would be a major negative long leading indicator. But actual construction starts are likely to continue to show strength until the near record backlog has been cleared. Since starts are the actual, hard economic activity, this indicates that housing is still going to make a positive to the economy looking out ahead 12 months.


In fairness, this is an amendment to what I wrote yesterday. Then I noted that there was no “pent-up demand” or “demographic tailwind” present anymore. That is true; but the backlog in construction due to supply shortages will delay any actual downturn affecting economic activity. 

Monday, April 18, 2022

The worst interest rate upturn since 1994 is likely to produce the worst housing downturn in over a decade


 - by New Deal democrat

No economic news of note today; but tomorrow we will see housing permits and starts for March, and on Wednesday existing home sales. So let’s take an important look at housing.

The recent increase in mortgage rates to over 5% is the most serious interest rate threat to housing in at least the past 30 years. As the below graph shows, the increase in over 2% is the biggest jump in mortgages since 1994:


But additionally, in 1994, when interest rates jumped from 6.75% to 9.25%, that was a 37% increase in monthly mortgage costs. The jump in the past year from 2.65% to 5.00% makes for an 89% increase in monthly costs. In other words, in 1994 a $1000/month interest payment jumped to $1370; in the past year a $1000 payment would jump to $1890!

And housing is very responsive to mortgage payments. Here’s a graph I have run many times before: the YoY change in mortgage rates (inverted, so that an increase in rates shows as a decrease; and *10 for scale), compared with the YoY% change in housing permits. Typically I only run this graph for the last 10 years; this time I’m taking it all the way back to before 1994:


The YoY change in mortgage interest rates now has only been matched by the 1994 change. In response, in 1995 housing permits were down -10% YoY, and 15% from peak to trough, as shown in the graph below of permits for the last 30 years:


The question, of course, is a 10% YoY decline from where. From the recent 1.9M high, the 1.6M low last summer, or somewhere in between? If the decline is 15%, as in 1994, that would take us back down to 1.7M permits. 

And I do expect a downturn. In 2013-14, there was less of a downturn than would be typically expected, partly because of pent-up demand from the Housing Bust, and partly due to the demographic tailwind of the Millennial generation reaching home-buying age. Neither of those buffers exist any more.

Because of the effect on monthly interest payments, as discussed above, I suspect it will be worse. And that would almost certainly have enough impact on the economy next year to put us close to if not in a recession, all by itself. 

Sunday, April 17, 2022

Paul Krugman on the Great Illusion of economic rationality and war — in 2008


 - by New Deal democrat

Paul Krugman wrote an article this past week about how free trade can enable authoritarians, and how Russia’s invasion of Ukraine may be putting an end to globalization. I went looking for an excerpt that wasn’t behind a paywall, and look what I found instead: the below article from Krugman in 2008, helpfully copied in the old Economist’s View blog.


In retrospect, it is an amazing read. I’ve highlighted In bold portions of particular interest.
——

“Is the ‘second great age of globalization’ about to end?”

The Great Illusion, by Paul Krugman, Commentary, NY Times: So far, the international economic consequences of the war in the Caucasus have been fairly minor, despite Georgia’s role as a major corridor for oil shipments. But as I was reading the latest bad news, I found myself wondering whether this war is an omen — a sign that the second great age of globalization may share the fate of the first. 

If you’re wondering what I’m talking about,... our great-great grandfathers lived, as we do, in a world of large-scale international trade and investment... Writing in 1919,... John Maynard Keynes described the world economy ... on the eve of World War I. “The inhabitant of London could order by telephone, sipping his morning tea in bed, the various products of the whole earth ... he could at the same moment and by the same means adventure his wealth in the natural resources and new enterprises of any quarter of the world.” 

And Keynes’s Londoner “regarded this state of affairs as normal... The projects and politics of militarism and imperialism, of racial and cultural rivalries, of monopolies, restrictions, and exclusion ... appeared to exercise almost no influence at all on ... internationalization ... which was nearly complete in practice.” 

But then came three decades of war, revolution, political instability, depression and more war. By the end of World War II, the world was fragmented economically as well as politically. And it took a couple of generations to put it back together. 

So, can things fall apart again? Yes, they can. 

Consider ... the current food crisis. For years we were told that self-sufficiency was ... outmoded..., that it was safe to rely on world markets for food supplies. But when the prices of wheat, rice and corn soared, Keynes’s “projects and politics” of “restrictions and exclusion” made a comeback: many governments rushed to protect domestic consumers by banning or limiting exports, leaving food-importing countries in dire straits. 

And now comes “militarism and imperialism.” ...[T]he war in Georgia ... mark[s] the end of the Pax Americana — the era in which the United States more or less maintained a monopoly on the use of military force. And that raises some real questions about the future of globalization. 

Most obviously, Europe’s dependence on Russian energy, especially natural gas, now looks very dangerous... After all, Russia has already used gas as a weapon...

And if Russia is willing and able to use force to assert control over its self-declared sphere of influence, won’t others do the same? Just think about the global economic disruption that would follow if China ... were to forcibly assert its claim to Taiwan. 

Some analysts tell us not to worry: global economic integration itself protects us against war,... successful trading economies won’t risk their prosperity by engaging in military adventurism. But this, too, raises unpleasant historical memories. 

Shortly before World War I another British author, Norman Angell, published ... “The Great Illusion,” in which he argued that war had become obsolete, that in the modern industrial era even military victors lose far more than they gain. He was right — but wars kept happening anyway. ...

Most of us have proceeded on the belief that ... we can count on world trade continuing to flow freely simply because it’s so profitable. But that’s not a safe assumption. 

Angell was right to describe the belief that conquest pays as a great illusion. But the belief that economic rationality always prevents war is an equally great illusion. And today’s high degree of global economic interdependence, which can be sustained only if all major governments act sensibly, is more fragile than we imagine.

___

Fourteen years later, I wonder if Krugman himself even remembers writing this.

For years I have been pounding on the theme Krugman relates in the second to last sentence of the article:
the belief that economic rationality always prevents war is an equally great illusion.”

Economic rationality is an assumption. And it’s an assumption that is only approximately correct if you have a large set of economic decision-makers, whose decisions fall along a typical distributional curve, with its center on the most “rational” decision. Once you have a more limited set of decision-makers, some of whom have market power, now the market is only as “rational” as those individual decision-makers. 

Further, the assumption is that people will pursue their preferences. You’re a vegetarian, I like beef. Economic rationality does not assert that either you or I have to change our preferences.

One hundred years ago, the monarchs of Central Europe were the decision-makers who counted, and what they wanted was to expand their influence into one another’s territory. It would have been meaningless to explain to Kaiser Wilhelm II, who was the only relevant decision-maker in Germany, that spending Germany’s treasury on a military build-up was economically wasteful. He pursued his preference.

Now Vladimir Putin, who is the only decision-maker who counts in Russia, has decided that Ukraine does not deserve a separate existence.

In 2008, Krugman was powerfully prescient. And yet how much folly has been loosed by  the modern neoliberal assertion that free trade is always good?