Saturday, October 9, 2021

Weekly Indicators for October 3 - 7 at Seeking Alpha


 - by New Deal democrat

My Weekly Indicators post is up at Seeking Alpha.

Although I have read a few pieces this past week about deep downgrades to Q3 GDP estimates, and other problems with sales, the fact remains that the high frequency indicators are almost all positive, across all timeframes.

As usual, clicking over and reading will bring you fully up to date on the economic trends, and bring me a little pocket change as well.

Friday, October 8, 2021

September jobs report: once again, two very different surveys net to a “relatively” disappointing gain


 - by New Deal democrat


As I previously indicated, two items I was particularly watching for in this morning’s report were (1) manufacturing hours and payrolls - to see if that white-hot sector was holding up in the face of supply bottlenecks, and (2) whether there were continued gains in leisure and hospitality jobs, or whether Delta had caused those to stall. 

While this morning’s report came in well short of expectations, with the big positive revisions to previous months the 6 month average of monthly gains is still over 600,000.

Here’s my synopsis of the report:

HEADLINES:
  • 194,000 jobs added. Private sector jobs increased 317,000, but government (mainly education) shed -123,000 jobs, having a great deal to do with haywire seasonal adjustments this year. The alternate, and more volatile measure in the household report indicated a gain of 526,000 jobs, which factors into the unemployment and underemployment rates below.
  • The total number of employed is still -5,333,000, or -3.3% below its pre-pandemic peak.  At this rate jobs have grown in the past 6 months (which have averaged 653,000 per month), it will take another 8 months for employment to completely recover.
  • U3 unemployment rate declined -0.4% to 4.8%, compared with the January 2020 low of 3.5%.
  • U6 underemployment rate declined -0.3% to 8.5%, compared with the January 2020 low of 6.9%.
  • Those not in the labor force at all, but who want a job now, rose 287,000 to 5.969 million, compared with 5.010 million in February 2020.
  • Those on temporary layoff decreased 128,000 to 1,124,000.
  • Permanent job losers declined -236,000 to 2,251,000.
  • July was revised upward by 38,000, while August was revised upward by 131,000, for a net gain of 169,000 jobs compared with previous reports.
Leading employment indicators of a slowdown or recession

These are leading sectors for the economy overall, and will help us gauge how strong the rebound from the pandemic will be.  These were mixed, and net to neutral:
  • the average manufacturing workweek, one of the 10 components of the Index of Leading Indicators, was unchanged at 40.4 hours.
  • Manufacturing jobs increased 26,000. Since the beginning of the pandemic, manufacturing has still lost -343,000 jobs, or -2.8% of the total.
  • Construction jobs increased 22,000. Since the beginning of the pandemic, -201,000 construction jobs have been lost, or -2.6% of the total.
  • Residential construction jobs, which are even more leading, rose by 2,100. Since the beginning of the pandemic, 42,500 jobs have been *gained* in this sector, or +5.1%.
  • temporary jobs declined by -5,200. Since the beginning of the pandemic, there have still been 256,800 jobs lost, or -8.7% of all temporary jobs.
  • the number of people unemployed for 5 weeks or less increased by 154,000 to 2,237,000, which is 155,000 higher than just before the pandemic hit.
  • Professional and business employment increased by 60,000, which is still -385,000, or about -1.8%, below its pre-pandemic peak.

Wages of non-managerial workers
  • Average Hourly Earnings for Production and Nonsupervisory Personnel: rose $0.14 to $26.15, which is a 5.5% YoY gain. This continues to be excellent news, considering that a huge number of low-wage workers have finally been recalled to work. 

Aggregate hours and wages:
  • the index of aggregate hours worked for non-managerial workers rose by 0.5%, which is a  loss of -2.8% since just before the pandemic.
  •  the index of aggregate payrolls for non-managerial workers rose by 1.0%, which is a gain of 6.0% since just before the pandemic.

Other significant data:
  • Leisure and hospitality jobs, which were the most hard-hit during the pandemic, gained 74,000 jobs, and is still -1,594,000, or -9.4% below their pre-pandemic peak.
  • Within the leisure and hospitality sector, food and drink establishments gained 29,000 jobs, and is still -930,400, or -7.6% below their pre-pandemic peak.
  • Full time jobs increased 591,000 in the household report.
  • Part time jobs increased declined -36,000 in the household report.
  • The number of job holders who were part time for economic reasons declined by -1,000 to 4,468,000, which is an increase of 70,000 since before the pandemic began.

SUMMARY

Once again there were two very different reports: the establishment survey was relatively weak for the second month in a row (again strongly influenced by the seasonality of the education sector), while the household survey was very strong.

In general there were weak gains across the board in all sectors of business hiring. Of the two areas I was most paying attention to, manufacturing hours were steady, and payrolls increased at their typical rate since the pandemic lockdowns ended. Meanwhile the food and beverage and wider leisure and hospitality sectors had their second month of very weak gains in a row, indicating a major impact from the Delta wave on consumer behavior. The most positive news was the continued strong increase in aggregate employee hours and wages, plus the second month in a row of very positive revisions to the prior two months’ data.

On the household side of the report, full time jobs increased sharply, while part time jobs declined slightly, and total jobs increased over half a million for the second month in a row. Both the unemployment and underemployment rates declined sharply once again. On the other hand, those not in the labor force who nonetheless want a job now increased.

I suspect that the more volatile household report is giving us a slightly leading signal vs. the establishment report, so I am discounting a little bit the mediocre job sector gains in the establishment report. At the same time, it is clear that the pandemic continues to have a big negative effect on services that involve indoor activities. 

All in all, a decent positive report - just not as good as most people were hoping for.

Thursday, October 7, 2021

A slow grind in new and continued claims as Covid’s effects gradually transition from pandemic to endemic


 - by New Deal democrat

Jobless claims declined 38,000 this week to 326,000, still 14,000 above the September 4 pandemic low of 312,000. The 4 week average rose 3,500 to 344,000, 8,250 above their September 18 pandemic low of 335,750:


Continuing claims declined 97,000 to 2,714,000, a new pandemic low:


Here is the YoY% change of continuing claims:


Based on the YoY change, it appears that the ending of all of the emergency pandemic assistance programs has had very little effect on continuing claims, at least so far.

With the Delta wave declining 40% from peak in the past month, the failure to make more downward progress in new claims is not due to changes in the pandemic, but more likely reflective of an economy grinding ahead with continued issues both in supply bottlenecks and in consumer (and potential employee) wariness in engaging in many indoor or crowded activities.

In tomorrow’s jobs report I will be paying particular attention to manufacturing, first in terms of average hours of work and secondly in changes in manufacturing payrolls themselves, to gauge whether supply bottleneck issues are affecting that leading sector. Whether retail jobs generally and leisure and entertainment jobs more specifically continue to improve is also going to be a focus.


Wednesday, October 6, 2021

Updated US wealth distribution data shows how bad the Great Recession and its aftermath were, and how effective the pandemic assistance has been


 - by New Deal democrat

The desert of new economic data this week continues today. But last week the Fed released its quarterly data on wealth distribution in the US, and it shows an important point about the efficacy of the emergency pandemic assistance. Let’s take a look.


Let’s start with the raw absolute levels of total wealth held by the bottom 50%, 50%-90%, 90-99%, and top 1% of the US population:


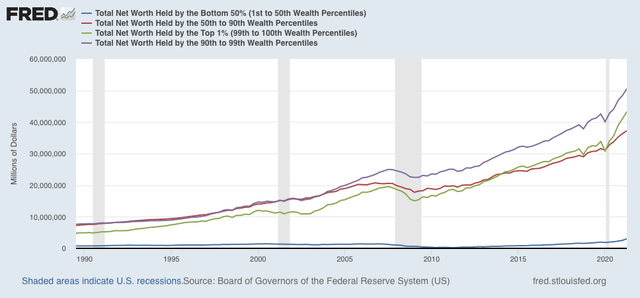
The total net worth of the US as of Q2 of this year was about $134 trillion (yes, trillion). Of that, only $3 trillion was held by the entire bottom half of the population. At the other extreme, the top 1% alone held assets worth $43 trillion.

Since the bottom half of the distribution shows up as squiggles at the bottom of the graph above, to better show the fluctuations among the groups, here is the same information normed to 100 as of the beginning of the series in 1989:


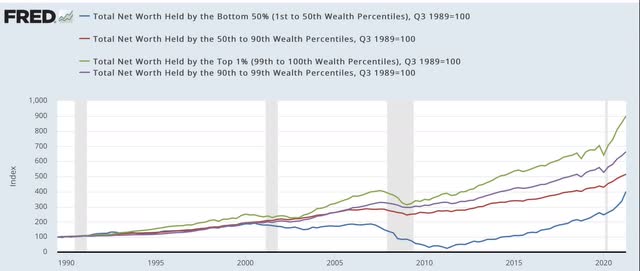
Most noteworthy is the virtual collapse - by nearly 90%! - in assets held by the bottom 1/2 of the population between its temporary peak in 2000 and several years after the end of the Great Recession in 2011. By contrast, with the exception of the stock market pullbacks during the tech crash and the first part of the Great Recession, the value of assets held by the top 1% has almost relentlessly increased in the past 30+ years.

Another way of looking at this is the %age share of total net US assets held by each wealth percentile, shown below:


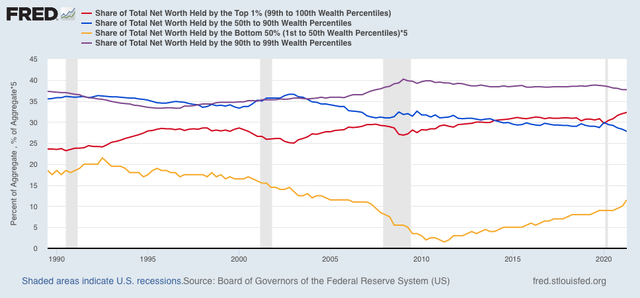
Again, with the brief exception of stock market pullbacks, the share of US assets held by the top 1% (red line) has increased almost continuously since 1989. By contrast, the share held by the bottom 50% (gold, multiplied *5 so that it shows up as more than squiggles) declined by 93% from 4.3% in 1992 to 0.3% in 2011.  A secondary phenomenon in both the absolute and %age share numbers is that the 50th-90th%iles (blue) and the 90th-99th%iles (purple) held roughly steady with one another until the 2000s, after which the wealthier cohort pulled away from the middle class cohort, and has retained that advantage since.

Next, let’s look at the YoY% change in wealth for each group:


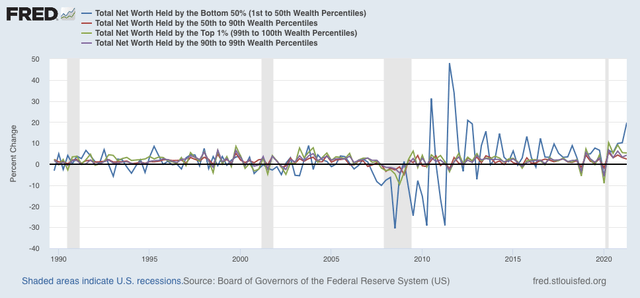
What is most noteworthy here, aside from the pasting that the poorer half of the US wealth distribution took during and after the Great Recession (frankly, a real indictment of both Bush’s and Obama’s emergency packages that bailed out Wall Street and the banks  and left Main Street dangling), is the ground made up by the bottom half of the wealth distribution in the latter part of the last expansion and even more dramatically as a result of the emergency measures put in place to deal with the pandemic. In absolute terms, the bottom 50% holds more wealth than at any point in the series (note, of course, this is not adjusted for inflation), but also the highest share of total assets than at any point since early 2006 - but still, only slightly more than 1/2 as much as the share they held at the end of the 1980s.

Finally, to give some indication of how this plays out in “real” terms, here are the total wealth amounts normed to 100 in 2006, and adjusted for the trade weighted value of the US$:


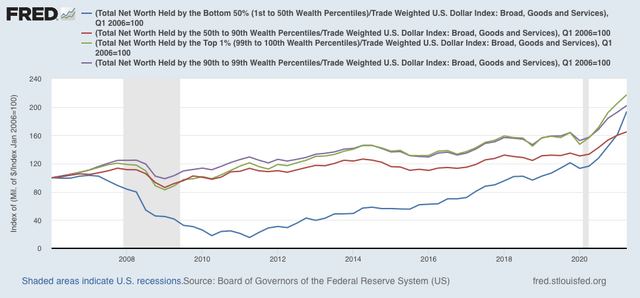
Again, how badly the poorer half of the US was treated during the Great Recession and the first part of the recovery thereafter shows up strongly, as does how well they did relatively speaking in the latter part of the expansion, and even moreso with the emergency pandemic assistance.


Tuesday, October 5, 2021

Housing and car sales, oh my!


 - by New Deal democrat


[If last week was a slow week for economic data, this week is a virtual wasteland until Thursday, so I took yesterday off.]

Last month I wrote that typically it has taken at least a 20% decline in housing construction to be consistent with an oncoming recession, and that we weren’t there yet.


As of the most recent housing permits report, single family permits were down 17% from their recent peak:


One of the most persuasive fundamentals-based models of economic cycles, by Prof. Edward Leamer, with decades of proof ever since World War 2, posits that housing is the most leading harbinger, turning down about 7 quarters before a recession, followed by motor vehicles, followed by producer durable goods, followed by consumer durable goods.

So, the most recent report on motor vehicle sales is not very encouraging. I have stopped following the private manufacturer reports, because most producers have cut back to quarterly rather than monthly reports, so the monthly numbers are mainly estimates. But the BEA issues its own report with a one month delay, and the most recent report for August, just released, showed a decline of over 10% for that month alone, and a total decline of 28% since April (blue in the graph below). Meanwhile, the more leading heavy trucks segment also declined 5% for the month, and a total decline of 19% since March (red):


Outside of the 1970 recession, heavy truck sales have declined at least 23% (and usually much more than that) before a recession began. Light vehicle, including cars, have typically declined at least 10%.

So heavy truck sales have not quite hit the point of being consistent with an oncoming recession, although cars and light trucks have.

It is important to note that our current situation is sui genesis compared with the past 70 years, because there has been no significant increase in either short or long term interest rates. Demand remains intact. 

This is entirely a supply bottleneck, which has driven prices for finished goods higher. A close analogy would be the oil shocks of the 1970s, at least one of which was an artificially caused supply shortage (the Arab Oil Embargo). The big difference here is that there is no wage-price inflationary spiral, because there are no unions able to obtain automatic “cost of living” wage increases. We have seen wages increase sharply in many places due to the pandemic, but with all emergency benefits ended, that has or shortly will almost certainly cease. If the supply shortages do not ease shortly, then the next thing to watch out for is whether more broad durable goods spending by both producers and consumers stalls. In particular real retail sales per capita has almost always turned negative YoY shortly before the onset of recessions in the past 70 years:


By contrast, at present YoY real retail sales are up almost 10%:


If that number were to suddenly plummet close to 0, I would be much more concerned that the supply bottleneck was on the verge of creating a recession.