Saturday, July 28, 2007

What Kirk Said

From the Kirk Report:

However, it frankly could have been far worse. We could have received evidence that most companies were not hitting their earnings estimates, that the economy was slowing down quickly, inflation was out of control, and/or some unknown event had increased the risk in the risk/reward equation, but that was not the case this week. Sure, there is legitimate fear that the problems over subprime, housing, and the M&A boom will turn to a bust and the market may be sending signals that these problems are ahead. But when I take a big picture look, I think there's a decent chance that the market overall was reacting to pure old-fashioned fear of the unknown. Moreover, I think we're also seeing a transition away from "everything is a buy mentality" to something far less aggressive. These kind of market transitions are never pleasant and can be very painful.


My perception of last week's sell-off is very middle of the the road. It doesn't surprise me. Let's face facts: there are some major problems out there in the economy. Housing has been tanking for the last year or so; subprime loan delinquencies are increasing and consumer spending was slow last quarter. Despite these problems, the markets have rallied for the last year or so with a few speed bumps along the way.

But there are also some good points to remember. Let's start with this quarter's GDP and do some simple back of the envelope calculations. GDP growth came in at 3.4% last quarter. This was in spite of the weak housing market and slow consumer spending. Exports were a big part of that number; they were responsible for 1.18 of the 3.4%. There is no reason to think this won't continue with a weak dollar and a strong global economy. Government consumption added .82 and gross private domestic investment added .49, thanks to a big kick from nonresidential investment. Let's assume that gross private domestic investment drops to adding 0.00 to GDP next quarter and government spending drops to its 15 quarter median of adding .25 to growth. Assuming all other elements of the GDP report contribute the same amount, the US would have GDP growth of 2.34%. This isn't great, but certainly not terrible. Also remember this quick calculation assumes the PCEs remain at adding 1.5 to the overall number.

The one wild care out there is the LBO/CDO/CLO market. As I wrote in the post below, banks are in decent shape, although they are increasing their loan loss reserves. In addition -- and here is the really big problem -- we don't know who owns what percentage of their portfolio in what assets. If hedge funds reported their holdings, we could find out right now who is in the worst shape and deal with it. But right now, we simply don't know. And that's a big problem that we're going to have to contend with and hopefully solve in the next few months.

The point is the underlying fundamentals aren't great, but they're not terrible either. There are economic sectors that are in decent shape. However, overall growth is very uneven. So long as housing remains a problem -- and it will for at least another 4 quarters if not longer -- expect this trend to continue.

In my opinion, the US economy has a bad case of the sniffles and a slight fever, but we're not hacking every 5 minutes and burning with fever. We can still work, but not as efficiently as we would like.
A More Optimistic View Of the Credit Markets

Let's start with what is happening right now:

``It's a story of heightened risk aversion,'' said Sue Trinh, a strategist at RBC Capital Markets in Sydney. ``The market is jittery that it's not contained to the U.S.''

Investors, whose confidence has been sapped by losses from subprime mortgages, are balking at absorbing more risky debt. More than 40 companies reworked or abandoned bond offerings in the past three weeks. The retreat forced banks to take on at least $32 billion of risky debt and threatens to bring an end to a record run for leveraged buyouts, which surged to a total $690.4 billion of deals this year.

``You have a stampede of the animals away from the watering hole,'' said Scott MacDonald, director of research at Aladdin Capital Management in Stamford, Connecticut, which manages about $20 billion in assets. ``Right now, everything that smacks of financial risk is backing out through the door.''


Let's translate the above eco-geek talk. Borrowers have gotten away with financial murder over the last few years. Lenders stopped asking for loan documentation and instead simply checked to see of a borrower had a pulse. Loan covenants went away or became incredibly lax. A loan covenant is a condition of the underlying loan. For example, a lender might stipulate that a borrower always have x% of his assets in liquid assets, or that the borrower always have X percentage of assets to liabilities, or any other of a number of other conditions regarding the loan. These conditions either ceased to exist, or were so lax that they essentially meant nothing.

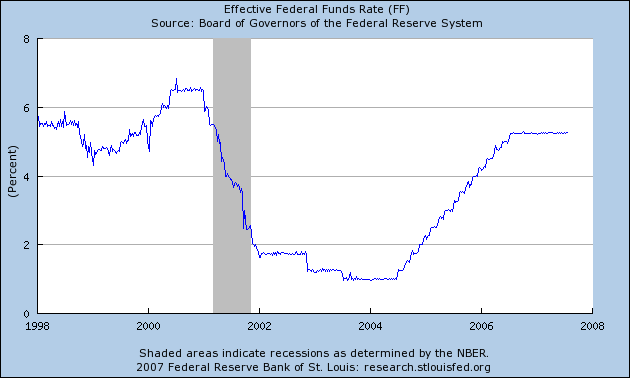
The main reason this happened is easy credit. In the early 2000s, the Federal Reserve lowered interest rates to historically low levels. Here's a chart from the St. Louis Federal Reserve of the effective federal funds rate for the last 10 years.

Photo Sharing and Video Hosting at Photobucket

Notice the rate was lower than 2% for 2 and a half years. This is the financial equivalent of lenders giving money away. From a negotiating perspective, record low rates give borrowers the advantage. A borrower can go to a lender and say "I'll give you x% over the prevailing rate, but you can't include really strenuous terms in the loan." When the borrower makes this offer, the lender is making loans at really low rates. Therefore it's harder to make money. When a borrower says "I'll concede a higher interest rate it you make the terms easier" the lender is more than likely to take the deal.

This has been the prevailing credit market sentiment for the last 5-6 years. Borrowers have been in control. This has led to the subprime problem in the housing market. Now that loose credit standards are starting to take their toll everyone is taking a step back to evaluate the situation.

However, the overall situation is nowhere near Armageddon levels.

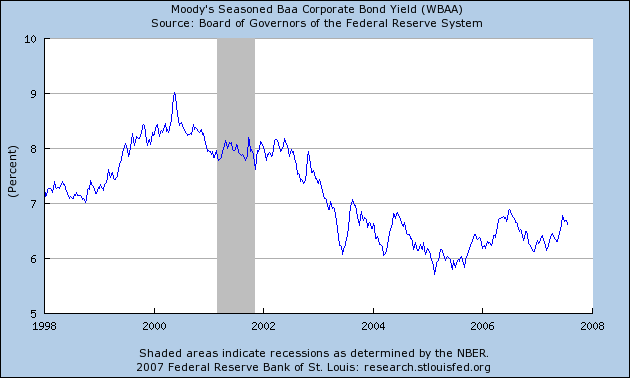
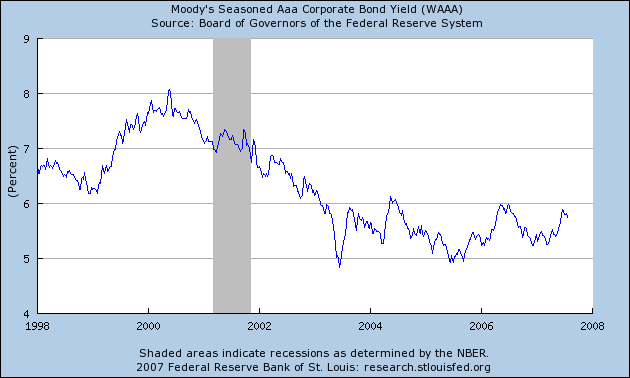
First, overall interest rates aren't that high. Here is a chart of the AAA corporate interest rate followed by the Baa corporate interest rate.

Photo Sharing and Video Hosting at Photobucket

Photo Sharing and Video Hosting at Photobucket

Notice that while interest rates have gone up, they're not that high. AAA paper is a little below 6% and Baa paper is about 6.5%. Simply put, this isn't that high. Even if AAA paper increased to 6.5%, the rate would still be pretty low. The point here is interest rates were higher at the end of the 1990s and the economy still hummed along just fine.

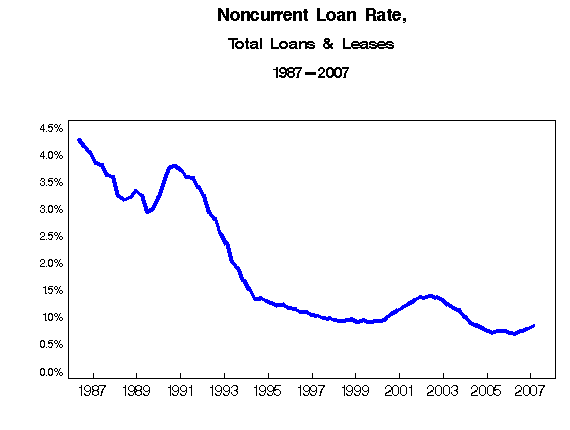
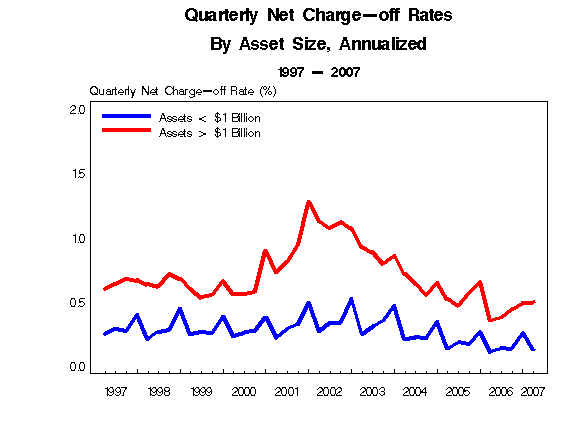
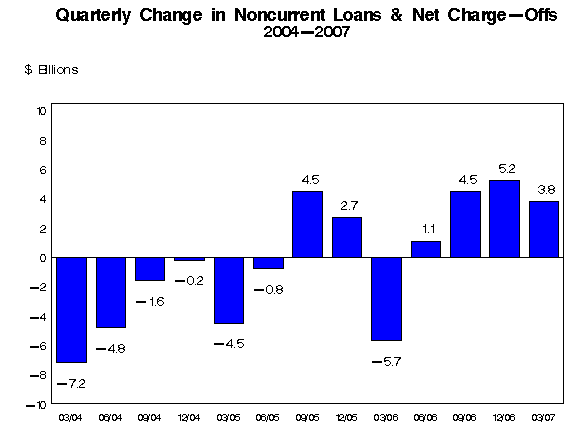
It's also important to note that banks are in pretty good shape. Here are some charts from the latest FDIC quarterly report.

First, the non recurrent loan rate is pretty low.

Photo Sharing and Video Hosting at Photobucket

Quarterly net-charge offs

Photo Sharing and Video Hosting at Photobucket

Quarterly Change in Non-recurrent loans

Photo Sharing and Video Hosting at Photobucket

From the financial side of the market, this is the first quarter when financial companies have stated that loan losses are increasing. That has everybody understandably spooked. However, as the above charts indicate, loan losses are pretty low and would have to increase pretty substantially before the financial companies were in terrible shape. That does not mean things are all rosy; but things are not all terrible either.

Most of what is happening right now in the credit markets is a reevaluation of credit risk. As firms and businesses go through this reevaluation they will stop all business. However, once this reevaluation is over, the chances are things will move forward albeit it at a slower pace. I would expect this process to last through the end of this year with credit becoming more available by the first quarter of 2008.

Friday, July 27, 2007

Weekly Market Summary

Considering the action in the markets this week, it seems appropriate to take a look back at the week to see what happened.

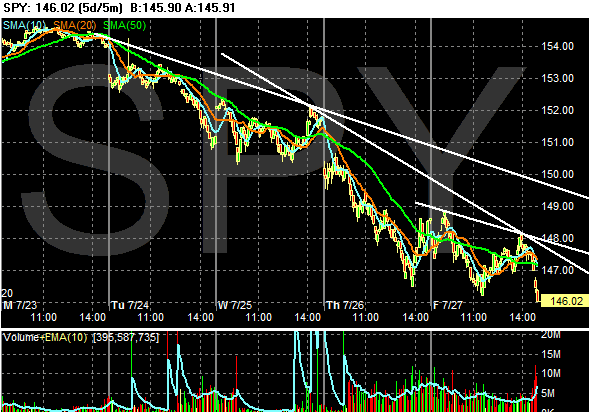
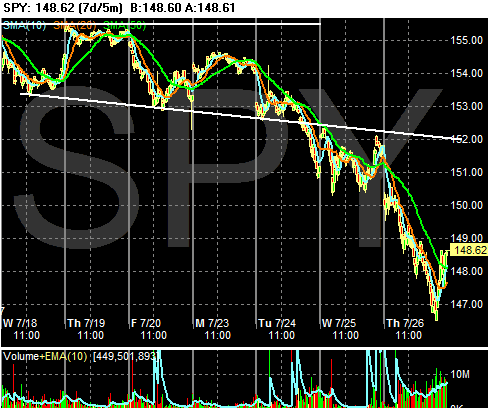
Here's a 5 minute chart that goes back 5 days. Notice the action for the whole week was down.

Photo Sharing and Video Hosting at Photobucket

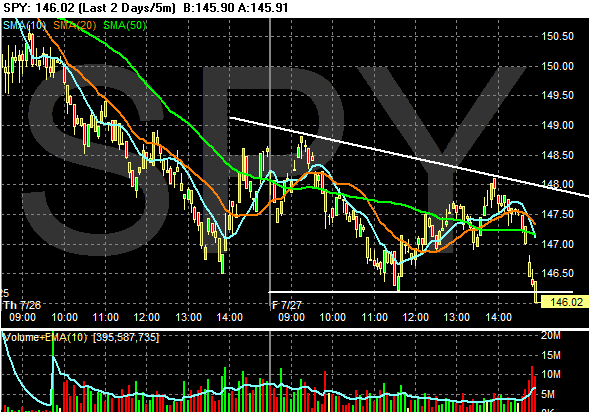
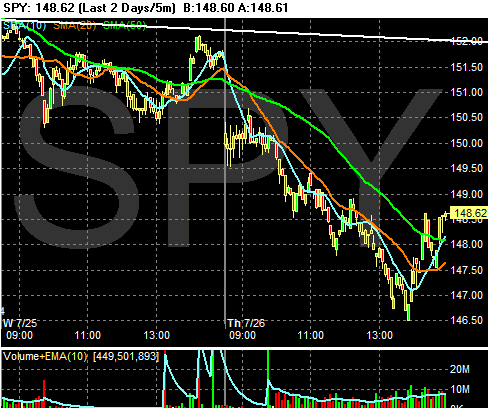
Here's a 2 day chart. Notice the end of the day sell-off on Friday (today). This shouldn't be surprising. Considering this week's action, no one wants to hold a position over the weekend.

Photo Sharing and Video Hosting at Photobucket

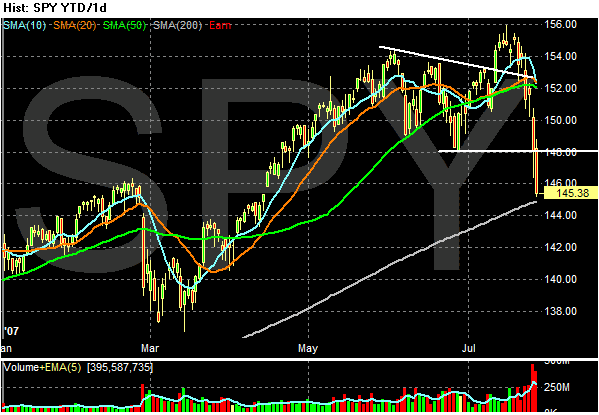
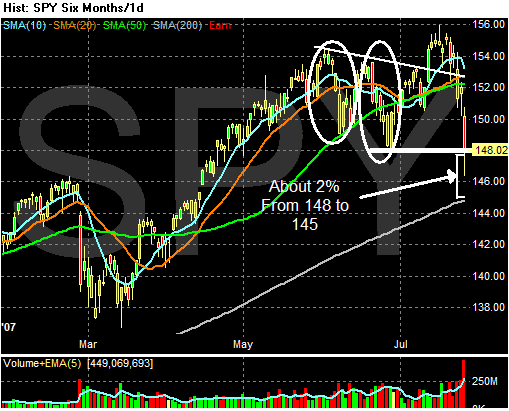
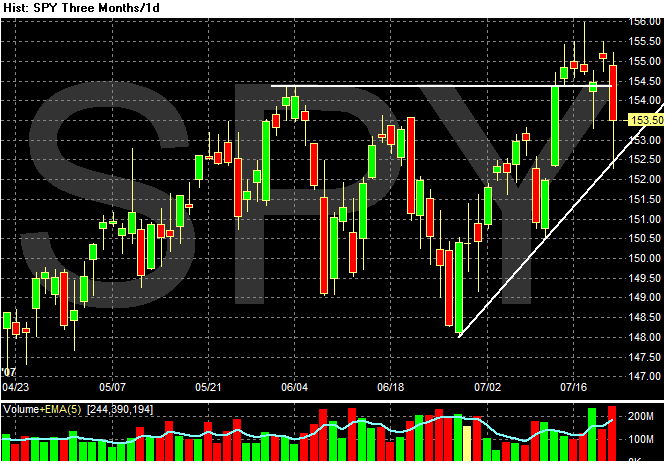
Here's the 3 month chart of the SPYs. Yesterday I noted that a drop to the 200 day moving average would be a drop of about 2%. This would make the total point drop for this sell-off about 10 points (roughly 155 - 145) or a total of 6.45%. This would be considered well-withing the range of a standard market correction.

Photo Sharing and Video Hosting at Photobucket

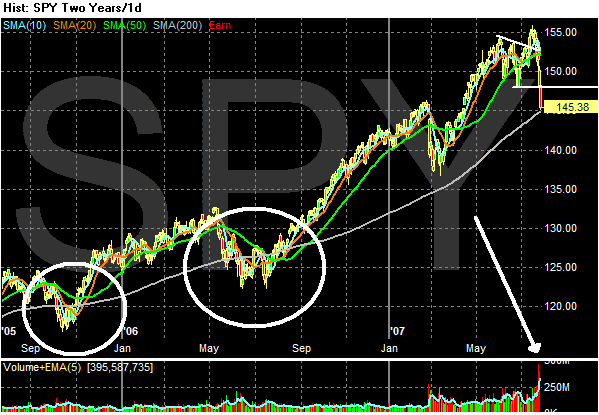
Let's take a look at the 2 year chart to see how the SPYs have performed when they previously approached the 200 day SMA. Notice it's been awhile since the average was here. Late October 2006 and June July 2006. However, the markets traded around the average for about a month and then rallied.

However, note the increased volume 1.) during the latest rally, and 2.) during the latest top. We could be seeing a selling climax right now, followed by some down time for the average.

Photo Sharing and Video Hosting at Photobucket

There are a couple of problem areas that we're going to look at.

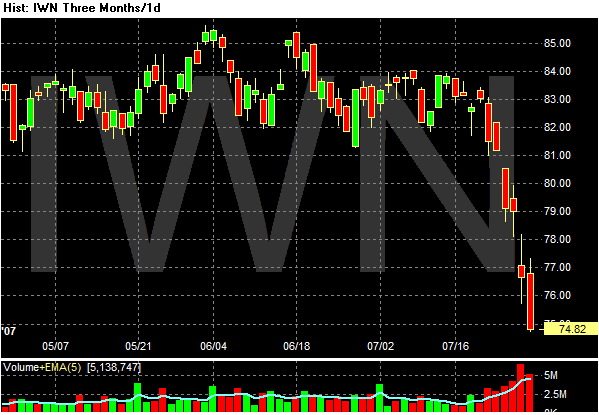
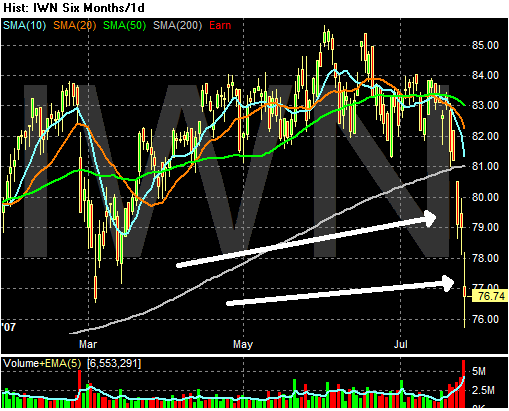
The IWNs (Russell 2000/small cap) are clearly dropping.

Photo Sharing and Video Hosting at Photobucket

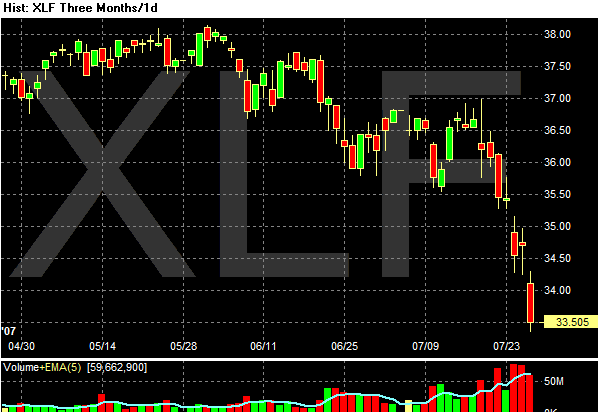
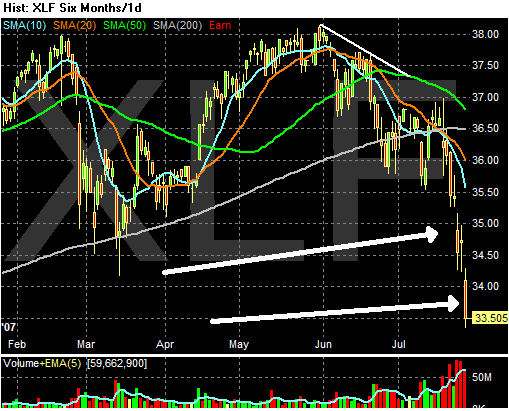
People are still bolting from the financials.

Photo Sharing and Video Hosting at Photobucket

Second Quarter GDP Up 3.4%

From the BEA:

Real gross domestic product -- the output of goods and services produced by labor and property located in the United States -- increased at an annual rate of 3.4 percent in the second quarter of 2007, according to advance estimates released by the Bureau of Economic Analysis. In the first quarter, real GDP increased 0.6 percent.

The Bureau emphasized that the second-quarter "advance" estimates are based on source data that are incomplete or subject to further revision by the source agency (see the box on page 3). The second-quarter "preliminary" estimates, based on more comprehensive data, will be released on August 30, 2007.


From Bloomberg:

The U.S. economy grew last quarter at the fastest pace in more than a year, propelled by rising exports, commercial construction and government spending.

The 3.4 percent annual pace of expansion followed a 0.6 percent gain in the first quarter, the Commerce Department reported today in Washington. The Federal Reserve's preferred inflation gauge rose at the slowest pace in four years.

Spending on commercial construction projects rose at the fastest pace in 13 years, helping to overcome another drop in homebuilding. Factories ramped up production to fill orders from Europe and Asia that made up for a slowdown in consumer spending. Smaller price increases may be of some comfort to Fed policy makers, who have said inflation is their biggest concern.


From CBS.Marketwatch:

After hitting a pothole in the first quarter, the U.S. economy rebounded in the second quarter, growing at an annual rate of 3.4%, the fastest pace since the first quarter of 2006, the Commerce Department said Friday.

The increase in real gross domestic product was slightly below market expectations for a gain of 3.6%, according to a survey of economists conducted by MarketWatch. See Economic Calendar.

GDP rose just 0.6% in the first quarter.


Let's go a bit deeper into the numbers.

Personal Consumption Expenditures Increased at a seasonally adjusted annual rate (SAAR) of 1.3%. This is the lowest quarterly increase since the fourth quarter of 2005. Consumer purchases decreased across the board -- durable goods, non-durable goods and services. Considering that 70% of U.S. growth comes from consumer spending, this is not a welcome development.

Residential investment decrease 9.3% SAAR. The previous four quarters came in at decreases of 11%, 20%, 16% and 17%. That makes this quarters number a bit of an increase from the previous 4 quarters. Considering the news from the housing sector, I have to wonder if this slower rate of decrease in investment will continue.

Non-residential construction increased at a 22.1% SAAR. This is the biggest increase we have seen this expansion. That means it may be a one time affair. Companies may have decided to make one last push on investment before they shuttered projects for the next few quarters. Whatever the actual reason, this pace is probably unsustainable.

Exports increased 6.4%. Thank-you cheap dollar.

Government spending increased 4.2%.

I think the best way to look at this report comes from CBS. Marketwatch:

Economists said the weakness in the first quarter and the subsequent strength in the second quarter are both overstated, and the best way to understand the economy was to average the growth rate over the past six months. This produces a 2.0% average growth rate in the first half of the year.

Thursday, July 26, 2007

What the Hell Happened Today?

Wow -- the trading day is over and it was very bad for the SPYs. Let's take a look at the charts to ses what happened.

Here's a chart of the SPY in 5 minute increments going back 7 days. Notice the market tried to make new highs several times and couldn't cross the thresh hold. Also note the SPYs went through the previous support level and went down quickly from there.

Photo Sharing and Video Hosting at Photobucket

Here's a 5 minute chart going back two days to see today's action in more detail. Notice the average dropped for most of the day. There were simply no buyers in the market until right before 2 PM

Photo Sharing and Video Hosting at Photobucket

Here's the SPYs daily chart. Note there were two previous selling periods in the last 3 months. The first occurred in late May/early June and the second occurred in mid-June. This indicates there has been an underlying skittishness to the markets for awhile.

Note we are still in bull market territory because we are over the 200 SMA. Also note he have about 2% more to go before we hit the 200 day SMA. If the average hits 145, then the correction will be about 6.5%. This would be a standard market correction.

Finally, note the incredibly high action on today's selling. Lots of people were heading for the doors. In the long run, this is a good thing because it clears out the dead wood in the market. Short term, however, it's obviously very painful.

Photo Sharing and Video Hosting at Photobucket

Here are two culprits. The first is the financial sector, which is basically in free fall right now. Investors are concerned about the debt markets. The CDO/CLO markets have gotten hammered lately. However, there is also concern about the health of the LBO market. The Chrysler deal may not go through. Overall financing for the recently announced LBOs is coming into question. Countrywide Financial's latest earnings announcement certainly didn't help. And the ongoing weakness in the housing sector is increasing the concerns related to foreclosures.

Note the average is below the 200 day SMA and the latest volume has been incredibly heavy.

Photo Sharing and Video Hosting at Photobucket

Finally, here is the IWNs -- a proxy for the Russell 2000. Investors are clearly getting out of the small cap game right now.

Photo Sharing and Video Hosting at Photobucket

So -- what does this mean?

1.) The market is clearly correcting. That's a no brainer.

2.) The market sold-off about 5.5% in late February/early March after the China market sell-off. We're 1% below that level right now, so there may be some more downside room.

3.) There are a lot of questions about the health of the financial industry right now. Until those questions are resolved, the markets will be nervous.

4.) There have been some earnings concerns. Exxon's slight drop did not help. However, there have also been some good numbers as well.

5.) Tomorrow's GDP report is now doubly important to the bulls.

Markets Having a Terrible, Horrible, No Good, Very Bad Day

As of this writing, the SPYs are down 2.36% and the IWNs are down 3.14%. By my rough calculation we're down about 4% for the week.

I'll have a market wrap after the close.

New Home Sales Drop 6.6%

Here's a link to the Census report.

From Bloomberg:

Purchases of new homes in the U.S. dropped more than forecast in June, signaling no end to the real- estate slump that's weakened the economy.

Sales fell 6.6 percent, the most since January, to an annual pace of 834,000 last month from a revised 893,000 rate the prior month that was less than previously estimated, the Commerce Department said today in Washington.

Builders may have to cut prices even more and sweeten incentives to turn sales around and trim bloated inventories. Rising mortgage rates and stricter rules to qualify subprime borrowers with poor credit histories will extend the worst housing slump in 16 years and continue to slow growth.

``The subprime debacle is definitely hurting,'' said Zoltan Pozsar, senior economist at Moody's Economy.com in West Chester, Pennsylvania, whose forecast matched the lowest at 850,000. ``This points to further construction drag on growth.''


The South -- which is the biggest region -- saw an increase of 7.6%. This was the only region with good news. The Midwest dropped 17.1%, the West dropped 22.5% and the NE dropped 27.1%. The number of new houses for sale remained the same, but the months supply increased to 7.8%.

These are really big drops and they indicate the correction may be accelerating.

The short version is simple: this report stinks. It confirms all of the bad earnings reports we have been getting from the homebuilders. It also indicates the credit tightening we have been hearing about is probably taking effect and tightening demand.

Ryland Homes, DR Horton and Pulte Post Big Losses

From the Street.com

Pulte reported a second-quarter loss of $507.5 million, or $2.01 a share, compared with profit of $243 million, or 94 cents a share, a year earlier. The loss was in line with the company's projection last week of $2 to $2.10 per share.

...

Elsewhere, Ryland posted a loss of $52.4 million, or $1.25 a share, compared with profit of $94.8 million, or $2.03 a share, a year earlier.


From CNBC

D.R. Horton Inc. said Wednesday it posted a deep loss in the fiscal third quarter as the homebuilder recorded one of the largest charges to date to write down the value of unsold inventory.

The Fort Worth, Texas, company posted a loss of $823.8 million, or $2.62 per share, in the period ended June 30, compared with year-earlier net income of $292.8 million, or 93 cents per share.

The most recent quarter included pretax charges of $835.8 million for inventory impairment and $16.2 million to forfeit deposits on land. Horton said the quarter also included a goodwill impairment charge of $425.6 million.


Raise your hand if you're surprised. Me neither.

Fed Releases Beige Book

Here's a link to the whole report

From the WSJ:

The overall economy continued to expand at a moderate pace in the past six weeks, say reports compiled by the 12 regional Fed banks. The Fed typically releases the anecdotal reports, known as its "beige book," two weeks before its policy makers meet to consider interest rates.

In an apparent reaction to the housing slump and rising energy prices, consumer spending rose at only a moderate pace in June and July. Many regions indicated retail sales were below expectations. Five of the 12 said sales of housing-related items, such as furniture or home-repair supplies, were weak or declining.


Here are some key points from the report:

On balance, consumer spending rose at a modest pace, although a number of Districts indicated that sales were mixed or below expectations Cleveland, Chicago, St. Louis, and Minneapolis all shared the general assessment that consumer spending rose modestly, while Philadelphia said retail sales growth was quite strong in May but "closer to trend" in June. New York, Atlanta, Kansas City, and Dallas reported sales as flat and/or below expectations. The remaining regions described sales as mixed


This is not the most glowing statement of consumer spending. It seems the housing slowdown and rising gas and food prices are starting to take a toll on discretionary purchases.

Most Districts said that residential construction and real estate activity continued to decline on balance. Many Districts, however, noted increased activity in some individual market locales or segments.

....

Commercial construction and real estate markets were generally more active than during the previous reporting period.


Over the last year, we've seen commercial/nonresidential construction spending increase. Now this makes up the largest portion of total construction spending. In his Congressional testimony, Bernanke stated residential construction workers had shifted to commercial projects, which explains why construction employment hasn't decreased.

Most District reports indicated that manufacturing activity continued to expand during June and early July.

....

In most Districts, the increases in demand for factory goods were spread across a number of industries.


This jibes with what the industrial production and various Federal Reserve District manufacturing reports have been saying.

Contacts generally reported ongoing input cost pressures, particularly for petroleum-related inputs, while prices at the retail level continued to increase at a moderate rate. Notable exceptions were the Richmond District, which reported faster rates of price increases as local businesses passed along higher input costs, and the Kansas City region, which experienced an easing in overall price pressures. Almost every region said that oil and gasoline prices were either rising, high, or "an issue."


For an organization that focuses on core inflation, the Fed seems to talk an awful lot about energy inflation.

Short version: consumer spending could be an issue in the upcoming GDP report.

Wednesday, July 25, 2007

Back Up And Running

Hey all --

I had a technical meltdown with Google. They have these things called robots that search the web looking for Spam web sites. They thought I was one, but I guess I'm not.

So, I'm back. Sorry for being away.

A

Tuesday, July 24, 2007

Debt Market Update

From Bloomberg:

The Wall Street money-machine known as collateralized debt obligations is grinding to a halt, imperiling $8.6 billion in annual underwriting fees and reducing credit for everyone from buyout king Henry Kravis to homeowners.

Sales of the securities -- used to pool bonds, loans and their derivatives into new debt -- dwindled to $3.7 billion in the U.S. this month from $42 billion in June, analysts at New York-based JPMorgan Chase & Co. said yesterday. The market is ``virtually shut,'' the bank said in a July 13 report.

Investors are shunning CDOs after the near-collapse of two hedge funds run by Bear Stearns Cos. that owned the securities. Standard & Poor's downgraded bonds from 75 CDOs as mortgages to people with poor credit defaulted at record rates. Concern about losses on home loans are rattling investors across the credit spectrum.


This slowdown shouldn't surprise anyone. Bear Stearns announced a hedge fund the invested primarily in CDOs and CLOs was essentially worthless. That's enough to get anyone's attention and force a reevaluation of the market.

And other deals are hitting snags:

Allison Transmission, a highly profitable unit of General Motors Corp. based in Speedway, Ind., has gotten stuck in a traffic jam in the debt-financing market.

Wall Street firms postponed a sale of $3.1 billion in loans that would pay for the leveraged buyout of Allison by private-equity firms, said a person familiar with the matter. While the sale of Allison to Carlyle Group LP and Onex Corp. is highly likely to proceed, the trouble raising debt from investors complicates matters for the company and its bankers.

The snag reflects difficult conditions in the market for risky corporate loans and bonds and raises questions about the prospects of other buyout-related debt financings that need to be completed this summer. That includes a $20 billion loan deal for Chrysler Group. Cerberus Capital Management has agreed to buy a majority stake in the auto maker from DaimlerChrysler AG.


While I don't think this mess will blow over, I do think it is overdone. The basic structure of CDOs -- that is grouping assets into a pool and then dividing the unerlying risk across various bonds -- has been around for about 15-20 years. Here's a brief refresher on how this works.

The basic premise of these investments is simple: pool a group of similar assets to diversity the risk and then parcel out the risk to separate investments carved from the pool. Let's create a simple hypothetical deal to explain this concept. We'll start with a $100,000, 30-year five percent mortgage. After the mortgage closes -- that is, after the borrower and lender have signed all of the paperwork and the borrower is "officially" a borrower -- the lender will usually sell the loan to an investment bank. The investment bank will then pool this mortgage with similar mortgages (same interest rate, maturity etc...) and create one giant pool. This process of pooling asserts can occur with literally anything that has a cash flow -- account receivables, loans, bonds -- you name it, and it can be pooled and carved into separate bonds or cash flows.

Suppose the investment bank creates a pool worth ten million dollars. That means there are now 100 mortgages in the pool. The basic investment concept of diversification tells us that a problem with a few of the loans will not impact the overall performance of the entire pool. Suppose five homeowners in this pool eventually default. There are still 95 mortgages that are making payments on time. This limits the problems created by the five loans that defaulted.

Let's add a complicating factor to this scenario. Suppose there is a problem with a larger percentage of the loans -- say 10 percent or higher. This is when the concept of "structured finance" comes into play. The investment back will create different bonds from the large pool and allocate the pool's payments to these different bonds at different times and at different rates.

Here's an example using the previously mentioned pool. Remember, we have a giant mortgage pool worth ten million dollars, and the pool is made-up of 100 mortgages each worth $100,000 that pay five percent interest. The investment bank will "carve" the ten million dollars into three different "tranches." For all practical purposes, each of these "tranches" is a bond.

Investment banks will usually create three types of bonds from these pools. The riskiest bond is usually called an equity bond, and when there are problems with the underlying pool, most of its loses are allocated to this bond. Using our previous, hypothetical example, suppose 10 percent or 10 of the mortgages in the pool are in default. The equity portion of the bond will absorb all of these losses. As a result, the other two bonds are still receiving their regular payments.

Let's suppose the number of defaults increases to 20 percent, so that 20 mortgages in the $10 million pool aren't making payments. The investment bank will now allocate most of the losses to the equity bond, but will also allocate any spillover losses to the mezzanine bond. This is the next riskiest bond in the structure.

Finally, there are investment grade bonds which are the last bonds to be hit by defaults. Because of the concept of diversification, this bond will usually not experience any problems.

One of the central problems with the CDO market is liquidity. Because there isn't a very active secondary market, there is no market pricing mechanism to determine what each bond is worth. Instead, fund managers use various formulas and methods to determine what the value of a security is. That's where the real problem is coming from. Had there been an active secondary market, market participants would have seen a gradual decline in the value of various bonds. Instead to Bear suddenly announcing two funds were worthless, investors in the market would have seen the funds decline in value over a specific period of time. This would have limited the shock from the Bear collapse.

Back to where we are now. Credit terms have been very lax for the last 2-3 years. What we are seeing now is a backlash against easy credit terms -- in essence, a massive tightening of credit standards. My guess is we will start to see the pendulum start to swing back within the next 12-18 months to a point between easy and tight.

Monday, July 23, 2007

When Will the Dollar's Decline Stop?

From the Financial Times:

How long before the dollar hits $1.40 to the euro? That is the question many analysts are asking after a week when the US currency struck a new low of $1.3843 to the euro and fresh multiyear lows against a range of currencies, including sterling.

The US currency has fallen 4.5 per cent against the euro this year and 4 per cent against sterling, hitting a new 26-year nadir against the pound last week. The trade-weighted dollar index dropped to its lowest since 1992.

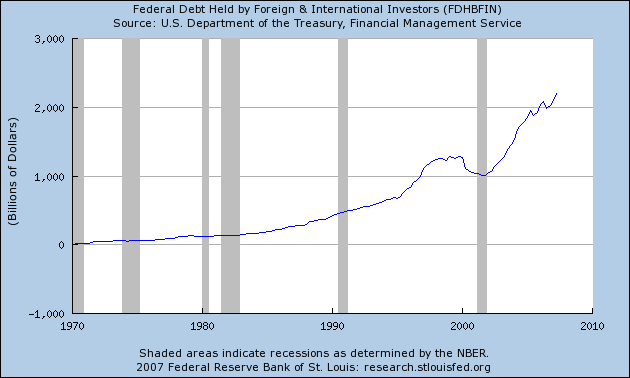
The dollar exchange rate is important because the US relies on hefty foreign purchases of securities and other assets to fund its current account deficit.

“At some point, the fall in the dollar will translate into foreign investors no longer buying US assets and selling their existing holdings,” said William Strazzullo, chief market strategist at BellCurve Trading.


The last paragraph states a really important question: when will the dollar's value decline to a level that makes investing in US debt securities a bad idea? There is no answer for that. However, consider the following chart from the St. Louis Federal Reserve which shows total foreign holdings of US debt securities. Notice the amount has more than doubled in the last 7 years.

Photo Sharing and Video Hosting at Photobucket

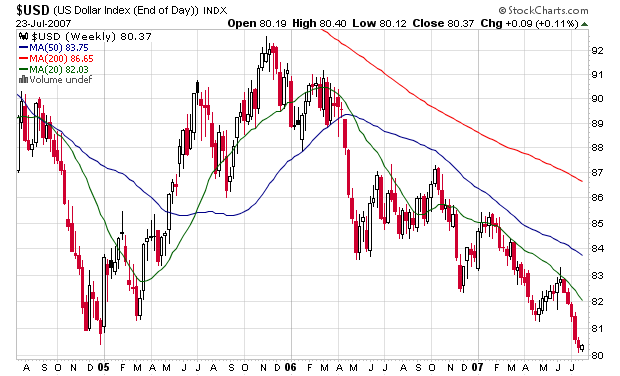
How long will this trend continue when the dollar's chart looks like this?

Photo Sharing and Video Hosting at Photobucket

Earnings Growth Pretty Good

From Bloomberg:

More than one-quarter of S&P 500 companies have posted second-quarter results. Their average profit growth was 8.1 percent. Analysts estimate index members will post average quarterly profit growth of 5.8 percent, up from a 4.8 percent estimate a week ago, according to data compiled by Bloomberg News.


It's not double-digit growth, but 8.1% isn't bad.

Metals Still A Buy?

From CBS MarketWatch:

"The long-term story for the base metals remains the same: Demand for metals continues to increase steadily," said Lawrence Roulston, editor of Resources Opportunities. Meanwhile, "production growth is constrained by the long lead times to develop new production and by the shortage of high-quality development projects."

"All metals have small inventories, which means any supply disruption can lead to a price bump,"
said Dr. Harlan Meade, president and chief executive officer of both Selwyn Resources Ltd. (CA:SWN: news, chart, profile) and Yukon Zinc Corp. (CA:YZC: news, chart, profile).

Base metals are even likely to find support from the rally in oil prices, "since the principle in economics is simply supply/demand fundamentals," according to Cary Pinkowski, chief executive officer of Vancouver, Canada-based CP Capital Group and director of Centrasia Mining


This has been a constant theme of the last few years. With China growing at high rates and India not far behind, demand for metal and other raw materials continues to increase. Here are some charts from Futures Charts.

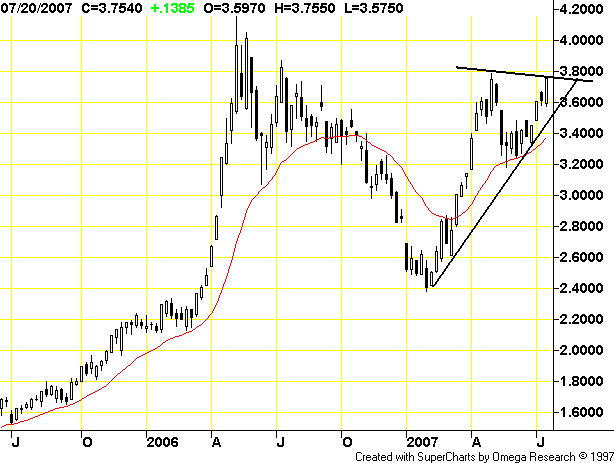
Copper

Copper sold off at the end of 2006. However, demand pick-up again in 2007, and the metal has been rallying since. Since April it has been consolidating in a triangle formation.

Photo Sharing and Video Hosting at Photobucket

Palladium

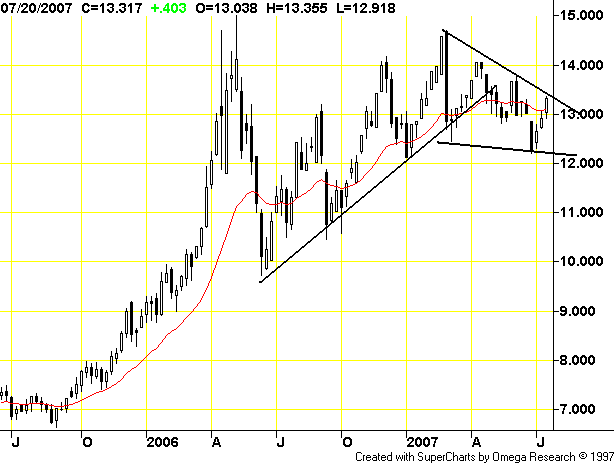
Palladium has had a slow and steady price increase since October of last year. That's a 10-month rally, which indicates the strength of the underlying increase in demand

Photo Sharing and Video Hosting at Photobucket

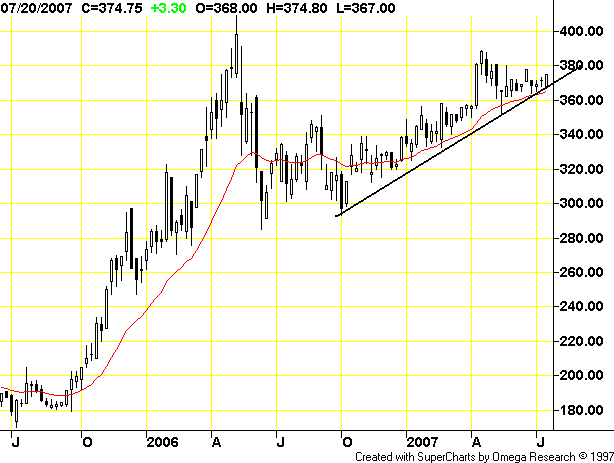
Gold

Gold had a 6 month rally starting in October of last year. For the last three months it has been consolidating in a triangle formation.

Photo Sharing and Video Hosting at Photobucket

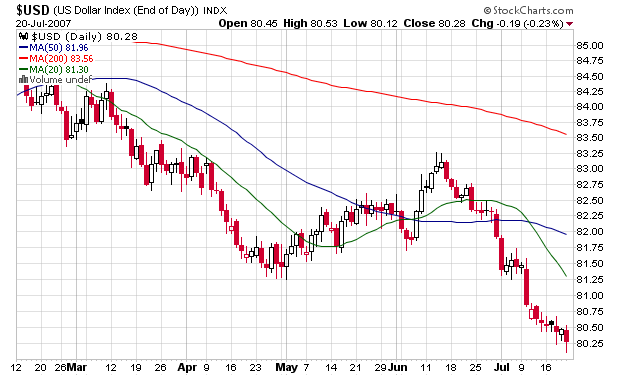
Keep an eye on the dollar's level. As the dollar approaches the $80 level it may apply upward pressure to gold.

Photo Sharing and Video Hosting at Photobucket

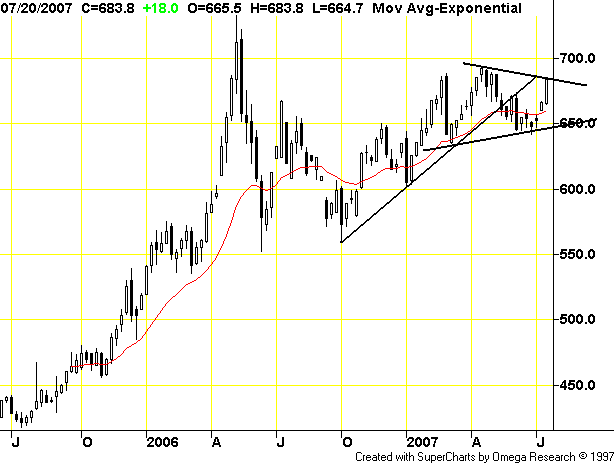
Silver

Silver rallied starting in June of last year. Since April it has been consolidating in a slightly downward forming triangle pattern.

Photo Sharing and Video Hosting at Photobucket

Aluminum

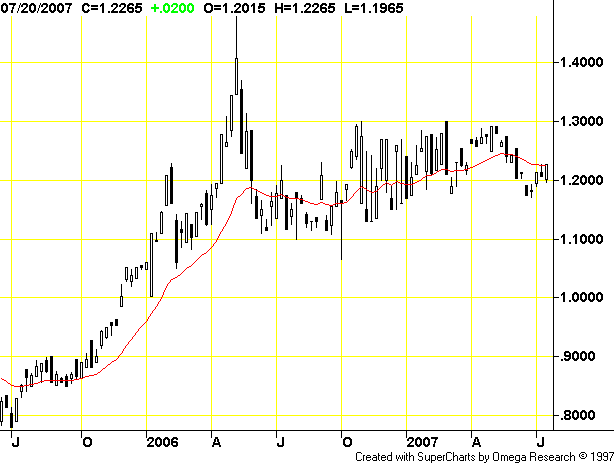
Aluminum is the one metal that hasn't had a strong rally. Instead, it's price has been near constant for the last year or so. However, note that it's price is still high on the chart, indicating demand is still higher now than it was a year or so ago.

Photo Sharing and Video Hosting at Photobucket

Sunday, July 22, 2007

Health Care Jobs

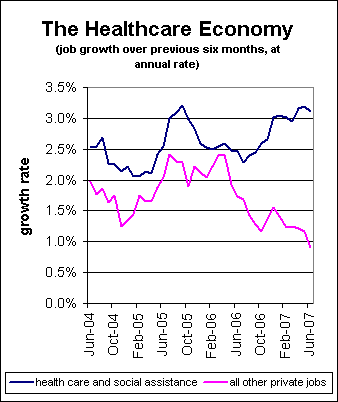
This chart is from Business Week. The author argues:

Basically, the non-health job market is in free-fall. I suspect that when the BLS issues the next round of revisions to the job numbers, the picture will look even worse.


Photo Sharing and Video Hosting at Photobucket

The S&P 500 Going Into Next Week

First, here is a chart of the S&P 500

Photo Sharing and Video Hosting at Photobucket

Here are some notes from my trading journal. They are in no order of importance.

-- The trend started in late June is still intact.
-- Daily MACD = +
-- Daily CMF = +
-- Daily OBV = Neutral
-- NYAD and NASDAQ AD = Bearish
-- NY and NASDAD NHNL = Fair
-- Subprime is still a problem.
-- Energy is good
-- Industrials are good
-- Tech to the rescue?
-- Financials are a big problem, and will probably continue in that vein
-- Friday market sentiment = Bearish (contrary indicator)
-- M&A is getting hit with stricter loan terms. But, I think this is more a return to prudent lending terms. Conditions have been incredibly lax and lenders have let borrowers get away with murder.
-- Zach's says earnings are good. Thompson says they're not:

Following a heavy week that saw 125 companies of the S&P 500 reporting, earnings growth for the second quarter is so far pegged at 5.2%, an improvement from 4.2% last week, according to Thomson Financial.