Saturday, February 2, 2019
Weekly Indicators for January 28 - February 1 at Seeking Alpha
- by New Deal democrat
My Weekly Indicators post is up at Seeking Alpha.
There are continuing if small shifts in all of the long leading, short leading, and coincident timeframes.
Friday, February 1, 2019
January jobs report: a tale of two almost diametrically opposed components
- by New Deal democrat
HEADLINES:
- +304,000 jobs added
- U3 unemployment rate rose 0.1% from 3.9% to 4.0%
- U6 underemployment rate rose 0.5% from 7.6% to 8.1%
Here are the headlines on wages and the broader measures of underemployment:
Wages and participation rates
- Not in Labor Force, but Want a Job Now: declined -73,000 from 5.327 million to 5.254 million
- Part time for economic reasons: rose +490,000 from 4.657 million to 5.147 million
- Employment/population ratio ages 25-54: rose +0.2% from 79.7% to 79.9%
- Average Hourly Earnings for Production and Nonsupervisory Personnel: rose $.03 from $23.09 to $23.12, up +3.4% YoY. (Note: you may be reading different information about wages elsewhere. They are citing average wages for all private workers. I use wages for nonsupervisory personnel, to come closer to the situation for ordinary workers.)
Is a recession close?
The more leading numbers in the report tell us about where the economy is likely to be a few months from now. These were mixed, with at very least a decelerating bias.
- the average manufacturing workweek fell -0.1 hours from 40.9 hours to 40.8 hours. This is one of the 10 components of the LEI.
- Manufacturing jobs rose by +13,000. YoY manufacturing is up +261,000.
- construction jobs rose by +52,000. YoY construction jobs are up +338,000.
- temporary jobs rose by +1000. YoY these are up +146,000.
- the number of people unemployed for 5 weeks or less rose by +199,000 from 2,126,000 to 2,325,000. The post-recession low was set eight months ago at 2,034,000.
Holding Trump accountable on manufacturing and mining jobs
Trump specifically campaigned on bringing back manufacturing and mining jobs. Is he keeping this promise?
Trump specifically campaigned on bringing back manufacturing and mining jobs. Is he keeping this promise?
- Manufacturing jobs rose an average of +22,000/month in the past year vs. the last seven years of Obama's presidency in which an average of +10,300 manufacturing jobs were added each month.
- Coal mining jobs fell -100 for an average of +150/month vs. the last seven years of Obama's presidency in which an average of -300 jobs were lost each month
Other important coincident indicators help us paint a more complete picture of the present:
- Overtime declined -0.1 hour from 3.6 hours to 3.5 hours.
- Professional and business employment (generally higher-paying jobs) rose by 30,000 and is up +546,000 YoY.
- the index of aggregate hours worked for non-managerial workers rose by 0.2%.
- the index of aggregate payrolls for non-managerial workers rose by 0.3%.
Other news included:
- the alternate jobs number contained in the more volatile household survey decreased by -438,000 jobs. This represents an increase of only 981,000 jobs YoY vs. 2,817,000 in the establishment survey.
- Government jobs rose by +8,000.
- the overall employment to population ratio for all ages 16 and up fell -0.1% to 60.7% m/m and is up 0.3% YoY.
- The labor force participation rate rose was unchanged at 63.2% and is up +0.4% YoY.
SUMMARY
The establishment and household surveys told very different stories this month, encapsulated by the 304,000 monthly gain in the former vs. a -438,000 decline in the latter. While the former is up almost 3 million in the last 12 months, the latter fell below a 1 million gain over the same period. To some extent this is due to the government shutdown affecting the household report, but not the establishment report (per the BLS). But it doesn’t explain everything.
Most importantly, of the four leading components in the establishment survey, one fell (the manufacturing work week), and two of the other three (manufacturing, and temporary jobs), while positive, showed sharply decelerating growth.
On the other hand, the very lagging measure of wage growth did continue to rise at a 3.4% clip, and the prime age participation ratio also rose to an expansion high.
Since the December report was excellent in virtually all respects, to some extent January is probably just a giveback. But all the same, there are plenty of cautionary signals in this report going forward.
Thursday, January 31, 2019
What to watch for in tomorrow’s jobs report
- by New Deal democrat
Last month I said to keep an eye on the temporary employment number in the jobs report, because it is a leading indicator for jobs overall.
But it isn’t the only such leading component. Manufacturing jobs, construction jobs, and the average number of hours worked in manufacturing jobs per week are also leading indicators for jobs overall.
I have two posts up showing this relationship for each of these sectors over at Seeking Alpha. Here are the links:
As usual, clicking over and reading not only helps you understand why you should pay attention to these sectors, but also helps reward me for my work.
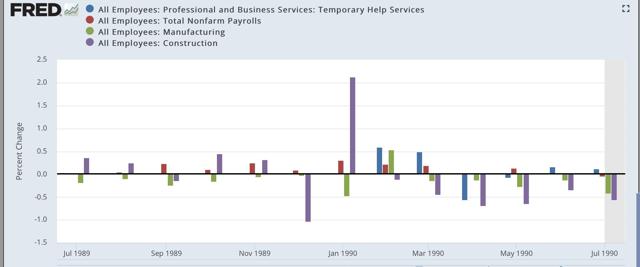
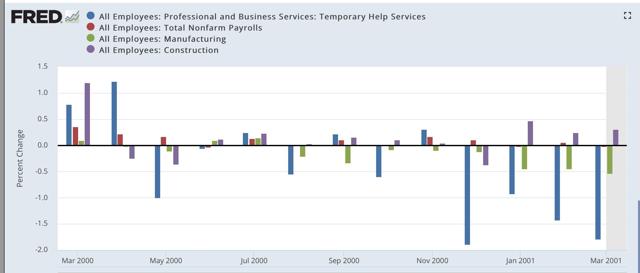
As a bonus, here are the monthly % changes in total jobs (red), temporary employment (BLUE), manufacturing jobs (green), and construction jobs (purple) in the twelve months just before the last three recessions, plus 2018:
1989-90
2000-01
2006-07

2018
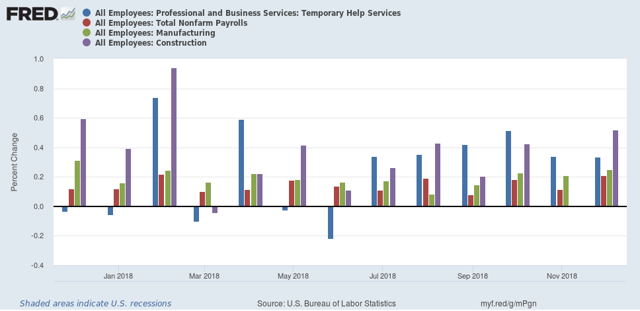
In the year prior to each of the last three recessions, at least two of the three leading jobs sectors — and sometimes all three — declined for months before the total number of jobs created monthly went negative. By contrast, with a couple of exceptions, all throughout 2018 all three leading sectors remained quite positive. This strongly suggests that, left to its own devices, the economy is not near a recession.
So I will highlight all three sectors when I summarize the jobs report tomorrow, looking for any changes.
BONUS BONUS! I’ll report on this more next week, but I wanted to point out that the Employment Cost Index for Q4 was reported this morning, and showed that the YoY change in *median* wages rose 3.1% in 2018 (+0.9% in Q4 alone). That’s the most in a decade and the highest during this expansion:
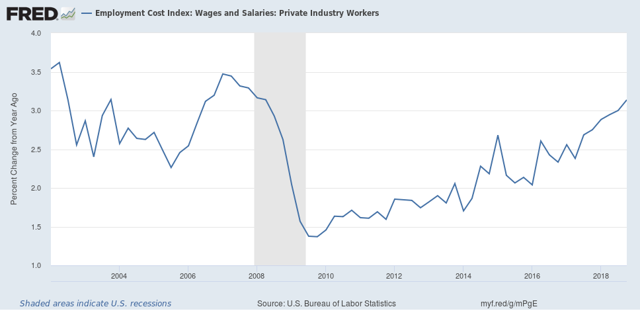
The labor market is finally tight enough that employers are starting to have to fork over some wage increases to average workers.
Subscribe to:
Posts (Atom)