Saturday, October 21, 2023

Weekly Indicators for October 16 - 20 at Seeking Alpha


 - by New Deal democrat

My Weekly Indicators post is up at Seeking Alpha.

Obviously the big story of the week was the surge in interest rates. The 10 year Treasury yield closed above 5% for the first time since 2007, and mortgage rates went above 8% for the first time since 2000!

Hard to see how the economy can withstand that for very long (if it persists!). But meanwhile the coincident data has been pretty consistently improving.

For all the gory details, click on over and read. And doing so will reward me just a little bit for pulling all the information together in coherent form.

Friday, October 20, 2023

Why the index of leading indicators failed: examining the once in a lifetime post-pandemic tailwind


 - by New Deal democrat

Carl Quintanilla observed the one year anniversary of the following two days ago:


I’ve written previously about what confounded that forecast. But let me highlight those issues again.

1. A 40% drop in gas prices, and a generalized 10% drop in commodity prices can do wonders for both producers and consumers.

Here’s a graph of the YoY% change in all commodities (blue), together with the YoY% change in oil prices (red, /10 for scale) going back 100 years:


The decline in commodity prices that began after June 2022 was only exceeded in the past 100 years by that during the Great Depression, the Depression of 1938, and the Great Recession. 

Here’s what absolute gas prices looked like:


So long as you don’t have wage deflation (as in the Great Depression), that is a powerful stimulant to downstream producers and consumers, who have more money freed up to spend on other things.

2. The freeing up of post-pandemic supply chains.

Not only did the un-kinking of supply chains help spur the above deflation in commodity prices, but they also provided a bigger capacity for production, particularly in the important motor vehicle industry (more on that below).

3. The slowdown in China probably also helped with the downturn in commodity prices for competing, and downstream, US producers and customers.

Good data out of China is hard to come by, but there seems little doubt that the Chinese economy has slowed sharply. Here’s the annual % change from FRED:


There is little doubt that the Chinese economy has slowed compared with its Boom years.

4. The unique post-pandemic un-kinking went directly to flaws in two very important leading indicators.

No leading indicator is perfect. The ISM manufacturing index has been around for 75 years, and had a near-flawless record of leading recessions, particularly if the total index fell below 48 and the new orders index fell below 45. But not only has manufacturing as a share of US GDP declined, but the ISM has the flaw of being an unweighted diffusion index. You count up the areas contracting vs. the areas growing, and if the former are greater than the latter, you get a reading below 50.

But because the index is not weighted, it can miss times when a downturn is broad but shallow vs. a sharp, concentrated upturn. And that’s what happened in 2022 and this year.

The below graph shows that the total index and its new orders subindex declined to recessionary territory by late last year - and have stayed there throughout this year:


But there has been a concentrated upturn in the motor vehicle industry, as shown by the below graph showing the # of light vehicle sales, industrial production of vehicles, and the $ amount of retail spending on vehicles:


All of these show a strong upturn since late 2021.

Similarly, pandemic-related bottlenecks in lumber and other production for the construction industry caused housing units under construction - the *real* economic measure of that important leading industry - to lag far more than usual behind the “official” leading indicator of housing permits:


Instead of turning down 3 or 6 months after permits, units under construction did not peak until a full year later, and even now are only down 2% from that peak.

The bottom line is that both the producer and consumer sides of the US economy benefitted since June 2022 from a gale-force tailwind, part of which was a (hopefully) once in a lifetime aftermath of a pandemic. That tailwind just happened to attack the weak points in several important leading indicators.

But as I have pointed out several times in the past few months, that tailwind almost certainly has ended.

Thursday, October 19, 2023

The collapse of the existing home market continues in September


 - by New Deal democrat


September was yet another month in the ongoing collapse of existing home sales. To wit, sales declined another -8,000 on an annualized basis to 3.960 million. This is the lowest number since August 2010. And aside from that one singular month, it is the lowest since 1995! [Note that this is similar to the collapse in purchase mortgage applications, also at the lowest level since 1995]:


The reason for the collapse, as I have noted before, is that existing homeowners are essentially locked in place by their 3% original or refinanced mortgages. They’re not selling, and they’re not going anywhere in the foreseeable future. Such houses as are on the market are disproportionately from people who have no mortgages, and so are insensitive to those rates.

And just as was the case for the past few months, with inventory so restricted, prices have held firm, and have even increased. In September, the median price was $394,300 (not seasonally adjusted), and is up YoY for the third month in a row, at +2.8% [note: current month’s data not included in the below graph]:


This is similar to what we saw with the FHFA and Case Shiller repeat sales indexes several weeks ago.

The result of the collapse of the existing home market is that more and more people have been driven to the new home market. Here are new home sales since 1995, to compare with the existing home sales graph above:


Even with their recent decline, new home sales are at a level equivalent to their level in 2019 just before the pandemic - which was itself a 10 year+ high. Although I won’t show the graph, recall that the prices of new homes have declined -10% or more on average, and less expensive multi-unit building is at an all time high compared with the construction of single family homes.

Finally, remember that it is new home building which is by far the most economically important data, because of the all the economic activity which goes into building the house, and then landscaping it from scratch, plus additional furnishings inside. This is an important reason why no recession occurred in the past 12 months. As I reported yesterday, now that new home construction has quite likely peaked as well, the odds of a recession in the next 12 months have increased substantially.

Initial claims on the cusp of turning lower YoY


 - by New Deal democrat


Initial jobless claims dropped below 200,000 last week for the first time since January, and not too far from the 50+ year low of 182,000 set in September one year ago. Specifically, they declined -13,000 to 198,000. The four week average declined -1,000 to 205,750, the lowest since February. Contrarily, with the usual one week lag, continuing claims rose 29,000 to 1.734 million:


I had surmised that there was unresolved seasonality in the similar decline this year in September as last year. But last year claims started rising steadily in October. Not so this year! If so, it could mean that the strengthening in the short leading data we saw this spring and summer has fed into more coincident data, as perhaps suggested by the big September increase over 300,000 in employment. We’ll see.

For forecasting purposes, the YoY% changes are more important, and here, for the first time in over half a year, one measure was not higher. Weekly claims are exactly even with where they were one year ago. The more important four week average is up 5.0%. Only continuing claims continue in very negative territory, up 28.8%:


Since continuing claims lag a little, I expect them to reverse lower in coming weeks.

Finally, since initial claims have a 50+ year history of leading the unemployment rate, the improvement in initial claims YoY averaged for the first three reports of October is up +2.5%. This suggests that the unemployment rate in the next few months may steady in the 3.7%-3.8% range (3.65%*1.025 = 3.75%):


This week was unadulterated good news. I’ll take it.

Wednesday, October 18, 2023

The last holdout in housing data has turned; ‘recession watch’ for next 12 months remains


 - by New Deal democrat

Last month I wrote that:


the biggest news was what happened with units under construction. The total declined slightly, as did single family units. But most significantly, for the first time since February 2021, multi-family units under construction also declined.

Why is this so important? Because, as this long term historical graph shows, total housing units under construction, although the most lagging of housing construction statistics, have also had to turn down before recessions begin. … multi-family units under construction, which typically turn after single family units, have also usually (except for 2008 and the pandemic) turned down before recessions have begun.

“It will take another couple of months’ worth of data to be more confident, but it certainly appears that the turn I have been waiting for in the housing market has finally happened. This is an important reason why, while I have removed the ‘recession warning’ from the end of last year, the ‘recession watch’ remains, pending a return down of several short leading indicators like vehicle sales and the stock market.”

So, let’s go directly to what happened with units under construction this month. 

Units under construction declined across the board. Total units declined 12,000 to 1.676 million, the lowest since April 2022. Single family units declined 5,000 to 674,000, the lowest since May 2021, and multi family units declined 7,000 to 986,000 for the 2nd decline in a row from July’s peak of 1.001 million:


With the addition of this month’s data, “it certainly appears that the turn I have been waiting for … has happened.”

Let’s update th more leading permits and starts.

Permits (gold) declined 68,000 to 1.473 million annualized. This number is about average for the last 12 months. The more leading and less noisy single family permits (red), however, rose 17,000 to 965,000, the highest since May 2022. Meanwhile the much noisier housing starts metric (blue) rose 81,000 to 1.358 million, still close to its low readings for the past 12 months:


Multi-family permits rose 12,000, and multi-family starts declined 75,000, both in ranges last seen at the beginning of 2021:


Finally, here is my updated graph of the YoY change in mortgage rates (blue, inverted, *10 for scale) vs. the YoY% change in housing permits (red):


As I have repeated for the last 10 or more years, interest rates lead housing permits. One year ago mortgage rates peaked at just over 7%. Just in the past few days, they have come within 0.1% of 8%. If this persists, we can expect permits to fall from about 1.4 million annualized to about 1.250 million in the next several months, which would be the lowest sinc 2019 except for the immediate pandemic lockdown months.

To reiterate: with increasing confidence I can say that the entire housing market has finally turned. If mortgage remains remain at their current levels, the likelihood of a recession at some point in the next 12 months has increased substantially. 

Tuesday, October 17, 2023

Like retail sales, motor vehicles lead the way in industrial production


 - by New Deal democrat


As with retail sales earlier this morning, motor vehicle production is playing an outsized role in expansion this year.

Industrial production as a whole rose 0.3% in September. But August was revised down by -0.2%, so on net it increased only 0.1%. Similarly, manufacturing production rose 0.4%, but with a -0.3% revision to August, was also only up 0.1%. Here’s what both look like for the past two years, normed to 100 as of production’s most recent prior peak last September:


On a YoY basis, industrial production is only up 0.1%, while manufacturing production is *down* -0.8%:


In the past, this would have almost always have meant recession. But since the China shock in particular, manufacturing in particular is no longer a big enough share of the economy to cause a downturn on its own:


Motor vehicle production has been playing an outsized role in the recent improvement. In September motor vehicle and parts production rose 0.3%. Below I show it normed to 100 as of its 2017-2019 average. Production declined as much as -80% during the months immediately after the pandemic hit, and averaged -14% for all of 2020 and another -8% in 2021 before returning to 100% beginning in April 2022. Only since April of this year has production been significantly higher, noting that it has slightly below its July peak:


On a YoY basis, motor vehicle production is up a very strong 7.0%:


This despite the strike that began late last month.

It may not be that hyperbolic to say that, but for the motor vehicle industry, the economy would be in recession.

A big jump in motor vehicle sales highlights a good September for retail sales


 - by New Deal democrat


 As usual, retail sales is one of my favorite metrics because it tells us so much about the consumer and, indirectly, the labor market and the total economy.


Nominally, retail sales rose 0.7% in September, and August’s already good 0.6% was revised upward as well. Since consumer inflation rose 0.4%, real retail sales rose 0.3% - still a very good monthly number. Here’s what the past 2.5 years, since the passage of the last big pandemic stimulus look like (blue) compared with personal spending on goods deflated by the PCE goods deflator. Both are normed to 100 as of March 2021:


Nominally both usually track close to one another; the difference is in the deflators. Previously it had appeared that the trend for real retail sales remained negative. But with this month’s result and last month’s revisions, both real sales and real PCE’s for goods have been in a clear uptrend this year, resolving a divergence between the two.

As a result, YoY both are now positive, with real retail sales up 0.1%:


Since real sales have a long if somewhat noisy record of leading employment, the above graph also shows the YoY% gains in jobs. The suggestion is that in the coming months the deceleration in jobs grains may stabilize.

Finally, the improvement in real sales isn’t solely a function of gas prices. Real motor vehicle and parts sales (gold) rose 1.3% in September after a solid gain in August, while real sales ex-gasoline (red) rose 0.7%. The only fly in the ointment is that both are still below their recent January peaks by -0.5% and -0.4% respectively:


Elsewhere I’ve noted that improvement in vehicle manufacturing has been a big counterweight to the decline in manufacturing in other sectors in the past year. Today’s report shows that the improvement in vehicle sales is clearly the biggest single contributor to the positive news about consumer sales this year as well. the un-kinking of pandemic supply chains continues to be a decisive component of the positive economic news this year.

Monday, October 16, 2023

The “bearish steepening” and the death of refinancing


 - by New Deal democrat

If you’ve paid much attention to the financial press in recent days, you have probably read stories that the yield curve - the line that traces the difference in rates in different length bond maturities - has moved towards un-inverting. That is, the situation whereby short term rates are higher than long term rates is moving in the direction of reversing towards a more usual pattern of longer term rates being higher.


But you’ve probably also heard this referred to as a “bearish steepening.” That means that the un-inversion of the yield curve isn’t happening because short term rates are moving lower, but rather because long term rates have been headed higher.

Is a “bearish steepening” of the yield curve in fact bad? Yes, it is. That’s because it means that the interest rates that consumers and businesses have to pay on loans are also headed higher. Those loans become more expensive, and economic activity slows down.

So let’s go to the graphs. 

First, here is a graph for the past 2 years of the Fed funds rate (red) compared with 10 year Treasury rates (blue):


When the red line moved above the blue line, that was an inversion. The inversion still exists, but the two lines reached their maximum difference in early May. Since then, and especially in the past month, the two lines have moved closer, mainly because Treasury rates have headed higher. That’s the “bearish steepening.”

Has this happened before? Here’s a look at the same data over last 40 years:


Note that several times in the 1980s and 1990s (particularly 1984 and 1994) both the Fed funds rate and Treasury rates moved higher. There was also one instance where an inversion resolved to higher rates (1998).

Let’s take a close look at these. Below I again show 10 year Treasury rates (red, right scale) compared with the yield curve measured by the difference between 10 year and 3 month Treasury maturities (blue, left scale):


We can see at least 5 instances in the 1980s and 1990s when the yield curve became more positive (i.e., longer rates relatively higher than shorter rates) at the same time as long rates themselves moved higher: 1984, 1986, 1994, 1996, and 1998. As mentioned above, only in the last case had the yield curve inverted.

The good news is, in no case following these “bearish steepenings” did a recession happen in the next 12 months. But the bad news, in all but one of these cases for our purposes, is why. 

Focus on the red line (Treasury interest rates). In 3 of the 5 cases - 1984, 1994, and 1996 - long term interest rates moved back down within 12 months to rates close to or even below the level they had been before the steepening began. This allowed consumers either to refinance mortgage debt at lower rates, or to buy new houses or vehicles at lower rates of financing.

To wit, here’s what happened with housing permits in the 1980s and 1990s (gold, right scale) compared with both long term rates and Fed funds rates:


In 1985, 1995, and 1997, housing permits increased significantly as buyers were able to lock in lower interest rate mortgages.

Although the data is noisier, the same thing happened with light vehicle sales:


Note there is a longer delay before vehicle sales moved higher or lower. This is because of a delay in the changes in motor vehicle financing rates:


But what about the other two times? In both 1986 and 1998, the economy was bailed out by 25% declines in gas prices (not shown). Even so, because interest rates did not decline to new lows in 1999, housing permits (see above) continued to decline, helping set the stage for the ultimate 2001 recession.

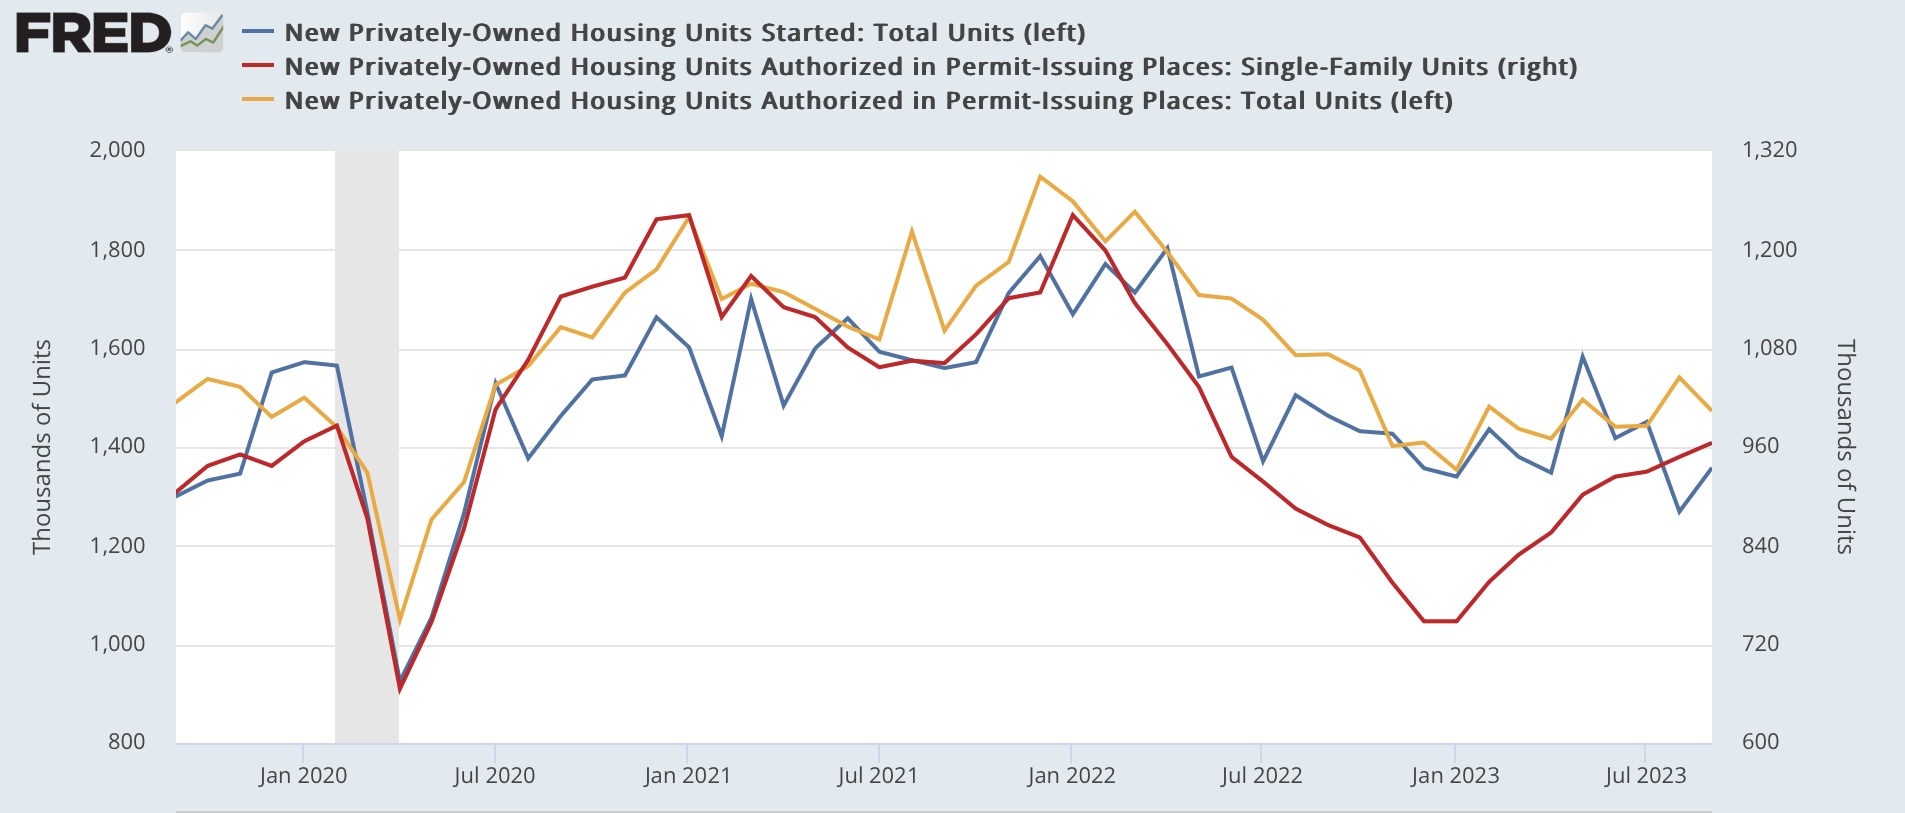
So what about now?  Remember that housing permits follow interest rates with a 3-6 month lag. Permits recently improved, following the decline in interest rates earlier this year. That is very likely to reverse lower in the months ahead (possibly beginning with tomorrow’s report for September):


And motor vehicle sales are giving equivocal signals, suggesting that they may be peaking:


Finally, turning to refinancing itself, here is a long term graph from Edward Yardeni of the Mortgage Bankers Association’s Refinancing Index:


Although the graph does not show the 1980s, note that refinancing all but stopped in 1994, but resumed with a sharp increase in 1995, and again in 1996-97. But it declined sharply and stayed down for a year or more in 1999-2000. The inability of consumers to refinance at lower mortgage rates, thus freeing up money for other spending, was a significant precursor to the 2001 recession.

As shown in the second graph from the top above, long term rates failed to make new lows for at least 3 years before the onset of the 1991, 2001, and 2008 recessions. As a result, as time went on, refinancing declined sharply. There were renewed bouts of refinancing after the Great Recession, and after the pandemic lockdowns, as long term rates hit new lows again. It is quite unlikely that we will see long term interest rates as low as they were in 2020 during our lifetimes, and 3 years have passed since then:


Now interest rates are at 10+ year highs, and as you can see from Yardeni’s graph, refinancing is all but dead. Even when interest rates go down again, because they are *very* unlikely to go as low as they were in 2020, refinancing is unlikely to be anywhere even remotely as common as it was between 2001-2020.

In conclusion, unless the yield curve actually un-inverts, the recession signal from its inversion remains. And the increase in long term interest rates can be expected to put further pressure on both business and consumer borrowing. It is indeed a “bearish steepening.”