Friday, January 6, 2023

December jobs report: good headlines, but deceleration continues


 - by New Deal democrat

If the long leading indicators all last year, and the majority of the short leading indicators from the past few months are to be believed, a recession is near. And if that is the case, we ought to see the leading elements of the jobs report begin to roll over. One of them, the average manufacturing workweek, clearly has. Arguably so has temporary employment. Residential construction employment may have peaked. But total construction and manufacturing employment continued to increase through November’s report.

So my focus as of this report is on those remaining leading components, as well as whether the deceleration in the 3-month moving average of jobs growth is continuing.

As described below, the deceleration continues, also including wages, but the leading sectors have not materially deteriorated from the past few months.

Here’s my in depth synopsis.

HEADLINES:
  • 223,000 jobs added. Private sector jobs increased 220,000. Government jobs increased by 3,000. The three month moving average of growth declined further to 247,000.
  • The alternate, and more volatile measure in the household report had its best month in quite awhile, increasing by 717,000 jobs. The above household number factors into the unemployment and underemployment rates below.
  • U3 unemployment rate declined -0.2% to 3.5%.
  • U6 underemployment rate also fell -0.2% to 6.5%.
Leading employment indicators of a slowdown or recession

These are leading sectors for the economy overall, and will help us gauge whether the strong rebound from the pandemic will continue.  These tilted to the negative:
  • the average manufacturing workweek, one of the 10 components of the Index of Leading Indicators, declined -0.3 hours to 40.6, and is down -1.0 hours from its February peak last year of 41.6 hours. This is recessionary.
  • Manufacturing jobs increased 8,000, and are at a level higher than before the pandemic.
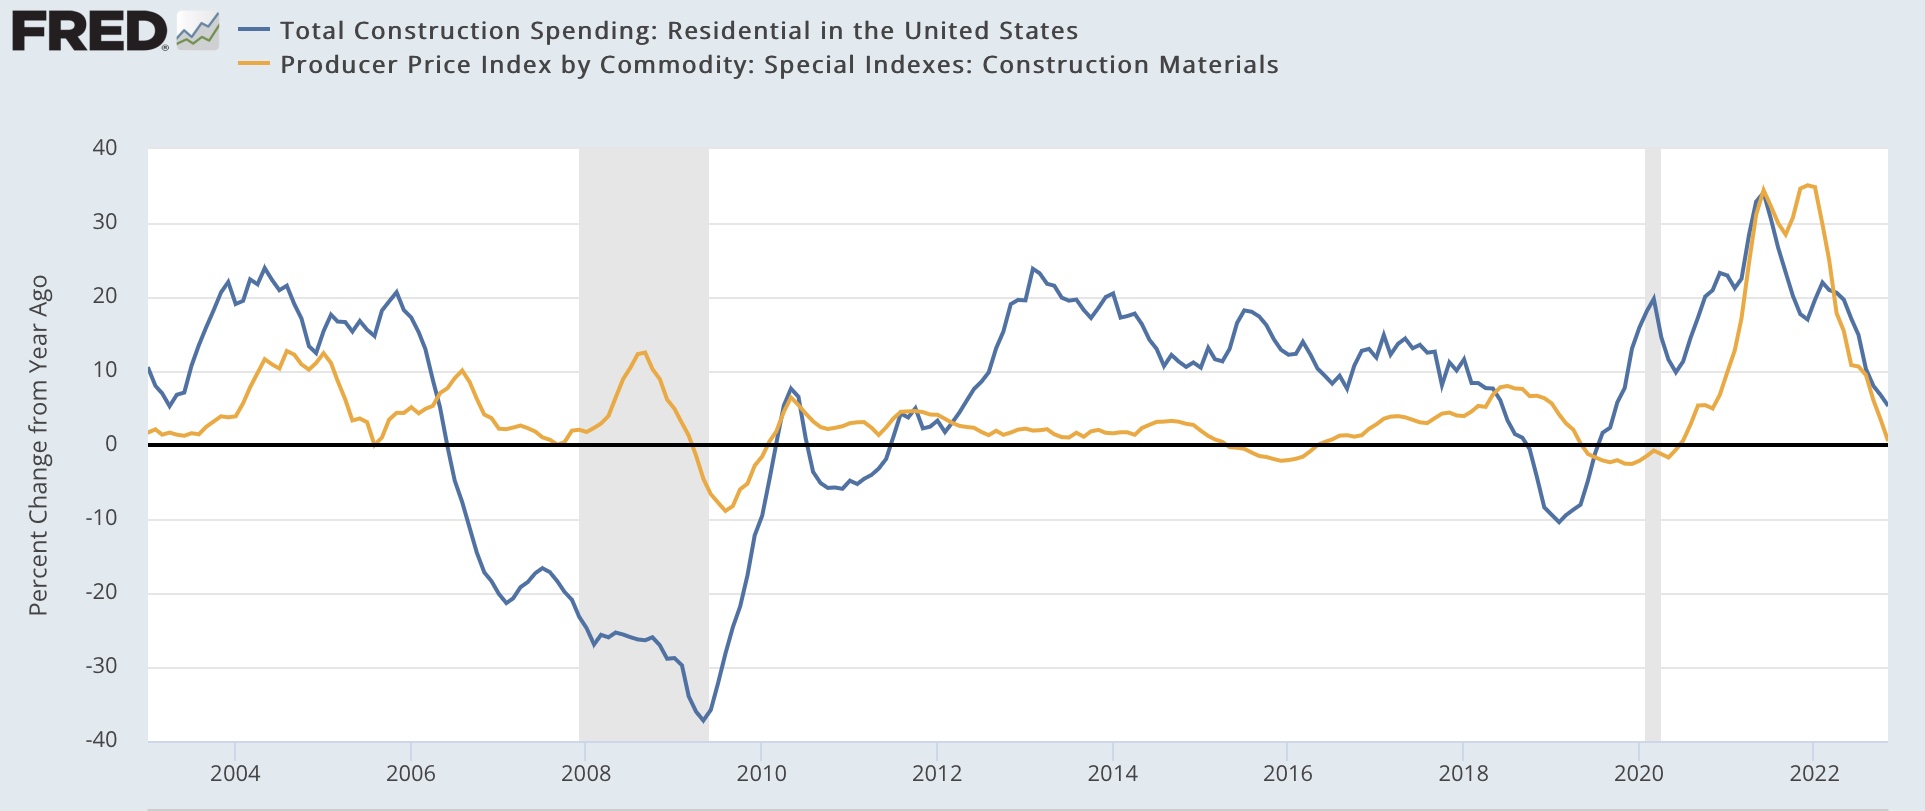
  • Construction jobs increased 28,000, also at a level higher than before the pandemic. 
  • Residential construction jobs, which are even more leading, increased by 3,100.
  • Temporary jobs, which until several months ago had been rising sharply, declined again, by 35,000.
  • the number of people unemployed for 5 weeks or less declined by 11,000 to 2,233,000, about 100,000 above its pre-pandemic level.

Wages of non-managerial workers
  • Average Hourly Earnings for Production and Nonsupervisory Personnel, which was recorded at $28.10 in November, was revised downward by $-.09, and increased $.06 from that to $28.07, a 0.2% gain m/m, and up 5.0% YoY, vs. its 6.7% peak at the beginning of 2022.

Aggregate hours and wages: 
  • the index of aggregate hours worked for non-managerial workers declined for the second month in a row, by -0.2% which is still above its level just before the pandemic.
  •  the index of aggregate payrolls for non-managerial workers was unchanged, and is up 7.4% YoY. This metric has been decelerating nominally almost consistently for the past 16 months.  Compared with inflation through November, it is up only 0.2% YoY (recessions typically start when it crosses zero).

Other significant data:
  • Leisure and hospitality jobs, which were the most hard-hit during the pandemic, rose 67,000, but are still about -6% below their pre-pandemic peak.
  • Within the leisure and hospitality sector, food and drink establishments added 26,300 jobs, but are still about -4% below their pre-pandemic peak. 
  • Professional and business employment declined -6,000, the second poor reading in a row after last month’s measly increased of 1,000.
  • Full time jobs decreased -1,000 in the household report.
  • Part time jobs increased 689,,000 in the household report.
  • The number of job holders who were part time for economic reasons rose 190,000.
  • The Labor Force Participation Rate increased 0.2% to 62.3%, vs. 63.4% in February 2020.
  • Those not in the labor force at all, but who want a job now, declined -352,000 to 5.176 million, compared with 4.996 million in February 2020.
  • October was revised downward by -21,000, and November was also revised downward by -7,000, for a net decrease of -28,000 jobs compared with previous reports. This is at least the second such downward revisions in a row.

SUMMARY

This report was mixed. There were many positive elements, including the unemployment and underemployment rates, labor force participation rate, and the absolute number of gains in jobs. The gains in the household report were the best in months. The leading sectors of manufacturing and construction employment continued to gain. It is nearly impossible to envision a recession beginning while that is still happening.

On the other hand, the manufacturing workweek declined to recessionary levels (suggesting job cuts will be close behind), and temporary employment continued to decline. Aggregate hours worked declined for the second month in a row, and aggregate payrolls were stagnant. There were again downward revisions to previous months’ data. Wages increased at the lowest pace in nearly two years.

This does not suggest to me that a recession is imminent, but it does suggest that deceleration in that direction has continued.

Thursday, January 5, 2023

New jobless claims end 2022 on a positive note; preview of tomorrow’s jobs report


 - by New Deal democrat

Initial claims started off the year - or ended last year if you are technical about it - on a positive note, declining 19,000 to a 3 month low of 204,000. The more important 4 week moving average declined 6,750 to 213,750, a two month low. Continuing claims for the prior week also declined by 24,000 to 1,694,000 (due to either a software or human entry glitch, FRED recorded the entries as December 31, 2023! Which leaves a one year gap, so I have omitted this week’s data on the graph below):


All three numbers also remained lower YoY. The most important leading indicator, the YoY% change in the 4 week moving average of new claims, is 3.2% lower than its level one year ago (due to the same glitch, this week’s data is omitted on the below graph):


Although seasonal distortions can be at their maximum right now, this is a very good weekly report.

Tomorrow we get the much more important monthly jobs report. Because initial claims lead the unemployment rate, and have remained low, I expect the unemployment rate to remain unchanged +/-0.1%. As to payrolls themselves, I expect the three month average of 272,000 to continue to slowly decline, which suggests a monthly number below 250,000. Because tax withholding came in negative YoY for the second month in a row in December, I will be on particular alert for a downside outlier compared with recent reports.

Additionally, I will be looking to see if there is deterioration in some leading employment metrics that haven’t rolled over yet; specifically construction and manufacturing employment. Since the weekly Staffing Index has also weakened in the past month, I will also be looking to see if temporary employment continues to decline. 


Wednesday, January 4, 2023

November JOLTS report consistent with a continued “hot” labor market


 - by New Deal democrat 

The JOLTS report for November showed both continuing decelerating trends in some series, but overall a picture of a labor market that continued “hot.”

Here’s the graph I ran one month ago of job openings, hires, quits, and total separations:


Now here is an update for the past 2 years of all four series:


Three of the four series - openings, hires, and total separations - show a pattern of continued deceleration since the beginning of this past spring, although only hires made a new 12+ month low is this report. Only quits appear consistent with a stabilizing market - although they too could be read as decelerating.

At the same time, both openings and hires continue at levels above any month that predated the pandemic.

In the eight years before the pandemic, layoffs and discharges averaged 1800 +/-100 monthly, with a low of 1500. Since the end of the pandemic lockdowns, they have averaged 1400 +/-100. At 1350 in November, they continue right in that range:


Taken as a whole, the JOLTS data for November implies a hot labor market; just not as hot as before.


December manufacturing, new orders both decline further, to readings even more on the cusp of recession


 - by New Deal democrat

I described last month’s ISM manufacturing reading as being one “on the cusp of recession.” Well, this month’s reading was even cusp-ier.

To recapitulate, this index has a very long and reliable history. Going back almost 75 years, the new orders index has always fallen below 50 within 6 months before a recession. Recessions have typically started once the overall index falls below 50, and usually below 48.


This is the second straight month that the index was below 50, declining another -0.6 to 48.4. As noted above, per the ISM itself, typically recessions have not begun until this index falls below 48, and as you can see below it came close in 2012 and 2015 without a recession happening. 

Meanwhile the new orders subindex declined another -2 to 45.2, a new expansion low and the 6th time in the past 7 months that it has been below 50:


Like I said, cusp-ier.

Note that industrial production, the King of Coincident Indicators, has declined in the past two months and looks very much like it has been in the process of peaking (blue the graph below), while manufacturing employment (red) has still been rising as of last month’s jobs report:


I don’t think a recession will start until we see those manufacturing employment numbers starting down. We’ll see in two days.

Tuesday, January 3, 2023

2023 data begins with another lesson: the remedy for high prices is - high prices


 - by New Deal democrat

And so, another year begins. And kicks off with a look at the leading housing sector. And furthermore, there is even some good news.


Total construction spending in November rose 0.2% for the month, while the more leading residential construction spending declined -0.5%. While total construction spending is only down 0.6% from its recent high in July, residential construction spending is down -8.1% from its recent peak last May:


This is in line with the steady drumbeat of negative news in the housing sector for the past year.

Generally speaking, residential construction spending comports with the number of housing units under construction. But in 2022, like in 2018-19, spending (blue) has declined while the number of units under construction (red) has risen slightly:


The answer probably lays in the costs of construction materials, for which there is a special inflation index, shown in gold YoY below compared with the YoY% change in residential construction spending:


The cost of materials increases and decreases with a lag once there is a boom or bust in construction. This is what happened in 2018-19, and it happened in 2022 as well. The cost of construction materials, which was up as high as 35% YoY one year ago, as of November was only up 0.6% YoY!

The remedy for high prices is - high prices. The good news is, with the complete abatement in the rise in the price of construction materials, some of the pressure is taken off of construction sales. 

As I’ve already mentioned several times, while I am watching for coincident indicators like employment and consumer spending to turn down, I am already on the lookout for a positive turn in some long leading indicators. And the abatement of construction costs increases in the housing sector is one such sign.