Saturday, September 26, 2020

Weekly Indicators for September 21 - 25 at Seeking Alpha


 - by New Deal democrat

My Weekly Indicators post is up at Seeking Alpha.

While the underlying economic data still looks positive, the possibility for disruption based on a full-blown Consitutional Crisis following the election can no longer be overlooked.

As usual, clicking over and reading should bring you right up to the moment about the economy, and reward me a little bit for the work I do putting this together.

Friday, September 25, 2020

New home sales confirm housing surge


 - by New Deal democrat


Yesterday new home sales were reported at a 10 year+ high, as were existing home sales earlier in the week.

This adds to the evidence that the housing surge is real, with positive knock-on effects for the economy over the next 12 to 18 months, once the pandemic is contained.

This post is up at Seeking Alpha. As usual, clicking over and reading should be educational for you, and it rewards me a little bit for my work.

Demographics, full-spectrum State by State polling reports for the Presidential election


 - by New Deal democrat


A couple of interesting items were reported yesterday in terms of the actual *election* in the Presidential election.


First of all, Survey Monkey reported 50 individual polls for each and every State. Nate Silver rates them D-, so take with lots of grains of salt, but the fact remains that these polls are filling in a number of holes in individual State polling.

The results were largely in line with prior polling for the States where they have been done, but there were a few surprises:

In addition a to Florida and North Carolina, Biden is reported as leading in both Ohio and Georgia.

Arizona is reported as tied (a poor result for Biden), but on the other hand so are South Carolina and Missouri.

Finally, Trump is reported as leading in Nevada, as well as swing States Iowa and Texas.

Like I already said, take with numerous grains of salt, but I think this polling highlights Arizona and Nevada as being not “in the bag” for Biden. On the other hand, it reinforces other polling showing the upper Midwest as a “blue wall” again.


Secondly, the Cook Political Report issued a “2020 Demographic Swingometer” showing graphically what would happen if you were to take the exact demographic breakdown in the 2016 Presidential vote, and adjust it for changes in those demographics over the last 4 years (e.g., a slight increase in Minority population, and a slight increase in the number of college educated voters).

Here’s the graph:


To cut to the chase, if the vote in November were to break down exactly as the Presidential vote did in 2016, Biden would win with 307 Electoral votes.

Everybody is well aware of how the complacency that “Hillary has this in the bag” killed her in 2016. I doubt anybody will make the same mistake this year. Nevertheless, these two reports are further grounds for guarded optimism.

Thursday, September 24, 2020

Initial jobless claims rise slightly, while continuing claims decline - both at still awful levels


 - by New Deal democrat

This morning’s jobless claims report indicated that the trend of “less worse” news is at best continuing at a snail’s pace, and at levels worse than the worst weekly levels of the Great Recession.

On a non-seasonally adjusted basis, new jobless claims rose by 28,527 to 824,542. After seasonal adjustment (which is far less important than usual at this time), claims rose by 4,000 to 870,000, slightly above their revised “best” reading of 866,000. The 4 week moving average, however, declined by 35,250 to a new pandemic low of 913,500:


Continuing claims declined both on a non-adjusted basis (by 176,510 to 12,264,351, and on a seasonally adjusted basis by 167,000 to 12,580,000, both new pandemic lows:


This remains almost exactly half of their worst levels at the beginning of May, and more than 4 million higher than the worst level of continuing claims during the Great Recession.

There has been only very slow downward movement in new jobless claims over the past seven weeks. As a result, the pandemic shock recession is gradually turning into something much more chronic at very depressed levels. 

Wednesday, September 23, 2020

Coronavirus dashboard for September 23: a pandemic course veering between panic and complacency


 - by New Deal democrat

Total US confirmed infections:  6,896,218*
Infections, average last 7 days: 43,411
Total US deaths: 200,786
Deaths, average last 7 days: 715

*my best guess is that the real number of total infections is roughly double that number, or about 14 million.

One of my consistent points over the past several months has been that, until there is competent federal leadership and/or an effective vaccine, the course of the coronavirus pandemic in the US would wax and wane as mass behavior varied between complacency and panic. 

This point of view has now been validated not just for the US, but for much of the world, as set forth in a piece recently by Joshua Gans, “Reproduction numbers tend to 1 and the reasons could be behavioural:”

[T]his pattern of R falling to about 1 happens across all states in the US and many countries in the world. To be sure, some countries actually suppressed the outbreak with R falling to 0 but for the majority, movement around 1 or just below it seems to be the norm. This regularity has been carefully documented by Atkeson et al. (2020). What happened was people are people and when they know they can catch an infectious disease by physical contact they adjust their behaviour accordingly....
....
When people understand that there is a dangerous coronavirus circulating, they engage in behaviour that reduces the rate at which they are infected even without governments ordering them to do so. That’s the good news. 
The bad news is that these people who react to what the virus is actually doing and similarly going to react when governments put in place various policies. If the government puts in policies that cause people to ‘stay in place’ and have law enforcement patrolling the streets as they did recently in Melbourne, then there isn’t much scope for people to react. But what if we engage in more modest policies such as testing, tracing and isolating which reduces the risk of being infected if you go out or we encourage mask-wearing with a similar desired effect? In that case, because their risk equation changes, people’s behaviour might change and this may have the perverse effect of increasing infection rates or, more assuredly, not reducing them by as much as might be hoped.

And that is precisely where we are, not just in US States, but in a large number of industrialized Western nations.

Let’s start by comparing the US with Canada and the 5 most populous countries in Europe. First, here is the 7 day average rate of new infections:


And here are deaths:


Spain, France, and to a lesser extent the UK are all having serious new outbreaks. The rate of deaths in Spain is already exceeding that of the US, with France gaining. Since deaths follow infections with a several week delay, we can expect further deterioration in those European nations.

Turning to the US, let’s first break things down by region, as to both infections (first graph) and deaths (second graph)


We can see that the panic in the South and West from their uncontrolled outbreaks of July and August led to a steep decline - until complacency set in particularly over Labor Day weekend. Meanwhile the Midwest, which earlier in summer had been making good progress, saw an increase first (most likely) from the motorcycle mass gathering in Iowa, and then again post-Labor Day. Even in the Northeast a little complacency has set in.

Breaking it down further, here are the top 25 States and Territories, first for infections and second for deaths:


The top 10 in each show a pandemic raging out of control, and verging on uncontrolled in the next 15. This is simply ghastly 6 months into the disease.

Now here are the bottom 10 for infections (first graph) and bottom 10 plus 4 other States where the death rate is averaging less than 1 per million daily:


Only the three States of northern New England - Maine, Vermont, and New Hampshire - are on par with neighboring Canada. New York, New Jersey, Connecticut, Massachusetts, and Washington State are reasonably close behind. This too has been the pattern for months: that there are only about 10 States where the pandemic has been brought under control, or nearly so.

Tuesday, September 22, 2020

Why compromise is so difficult: for most people, social issues are moral issues


 - by New Deal democrat

Kevin Drum makes a point this morning that I want to expand upon:
 

 These are hardly tremendous odds against Democratic control [of the Senate].... The real complaint is that the Senate favors small states—which is true—and thus favors Republicans—which isn’t. There’s nothing about a small population that automatically makes a state Republican. Delaware’s Senate delegation is Democratic. Oregon is Democratic. Hawaii is Democratic. New Mexico is Democratic. [NDD: So are Vermont, New Hampshire, Rhode Island, Connecticut, and geographically Maryland, New Jersey, and Massachusetts as well.] Ditto in reverse for big states: Texas is Republican. Florida is Republican. Ohio is Republican. Georgia is Republican.


The problem is that US politics over the past few decades has become less and less about economic issues and more and more about social issues, and that makes elections into moral crusades. And that, in turn, means that compromise is all but impossible. As recently as a decade ago, for example, Senate Democrats unanimously supported the “Gang of Eight” compromise immigration bill. Today it’s unlikely a similar bill would even attract a majority of Democrats. In fact, many of the immigration plans that were floated during the Democratic primary this year came within shouting distance of supporting open borders.

Democrats could obviously win more swing states if they wanted to, but it would mean making compromises on hot-button social issues like abortion, guns, police, religion, immigration, and so forth. Instead, the party has moved left on theseissues and activists are now infuriated that it’s paying a price among center-left voters in swing states.

 I don’t agree with everything Drum says above. In particular, I don’t see any evidence that center-left voters are abandoning the Democratic Party. Quite the contrary!


But I very much agree with Drum’s point that compromise is all but impossible when the defining line is social issues.

Here’s a dot-plot of the 2016 electorate, dividing it on both the economic and social-issue scales:


You can see that very few people are actual libertarians, i.e., favoring social liberalism and economic laziness-faire. On the other hand, about 1/3 of the electorate is broadly left economically, but somewhat to very conservative on social issues.

Could the Democratic Party attract more votes by attracting more socially conservative voters? Certainly, but how?

The fundamental problem is that positions on social issues are almost always viewed through the lens of *morality.* They aren’t just “social” issues, they are *moral* issues.

So, how would you feel about compromising on an issue of morality? For most people, I think, that is anathema. If the opposite position is anathema, then there is no ability to get beyond the issue.

If moral issues are the filter through which political candidates must pass before economic and other issues are considered, then it’s obvious from the above dot-plot that more socially conservative candidates are going to have an advantage. And the GOP has made use of that for 50 years.

Still, as the Japanese say, “there are many paths to the top of Mount Fuji.” With the important exception of abortion, which is almost completely an intractable dispute, I do believe there is some room for compromise, by making liberal use of “conscience clauses” where reasonably possible. So long as I am exempted from active participation in a matter that I consider morally repugnant, I can get along with others who hold a contrary view, and we can both support candidates who agree with our points of view on economic issues.

After all, modern liberal society in the West ultimately grew out of the agreement by Protestants and Catholics in the 17th and 18th centuries to stop oppressing and slaughtering one another with wild abandon, and to allow “liberty of conscience” in the civic sphere. If actual religious issues can be overcome, at least most social, i.e., moral, issues in contemporary society can as well.

Monday, September 21, 2020

A macro view of how the 2020 Presidential election differs from 2016


 - by New Deal democrat


This is a light week for economic data, so don’t be surprised if I take a break for a day or two.


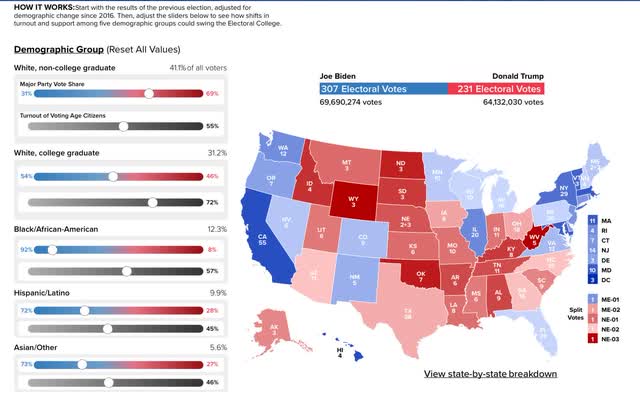
In the meantime, I wanted to post a few graphs that I think give a good “macro” view of the Presidential election this year, and how it is different from 2016.

Aside from the fact that Trump now has a nearly 4 year record, and Presidential elections are usually a referendum on the incumbent President or party, the simple overriding fact is that Biden is viewed much more favorably, or perhaps much less *un*favorably, than Hillary Clinton was in 2016. 


To refresh your memory, here are a couple of graphs showing how (dis)liked both Trump and Hillary Clinton were in 2016:


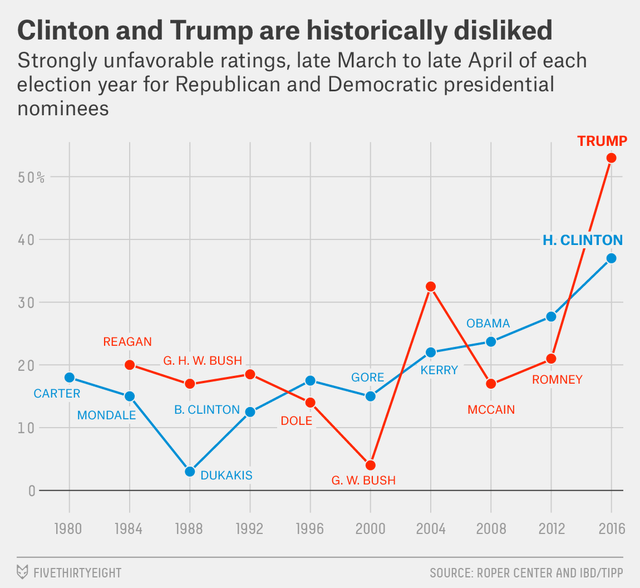
Both were historically more disliked than any other previous candidate of either party. Almost 50% of likely voters *strongly* disliked her, and majority did dislike her:


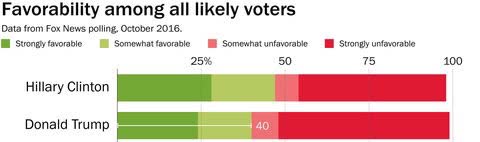
NOTE IMPORTANTLY: I am not making a value judgment that Hillary Clinton was dislike*able*. I am simply reporting that she was in fact historically disliked. When right in the middle of ongoing early voting, Comey insinuated that she might be a crook, that’s all it took to give Trump his inside straight win in the Electoral College.

As a result of the fact that *both* candidates were historically disliked, there were wide swings in voter intentions throughout 2016, depending on which candidates problems were dominating the front page. Here’s the static-y day by day view:


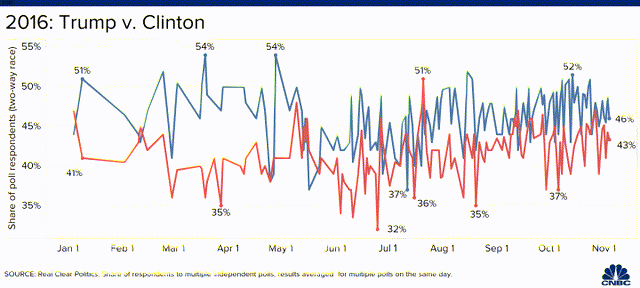
Note that there were several brief periods where Trump actually led.

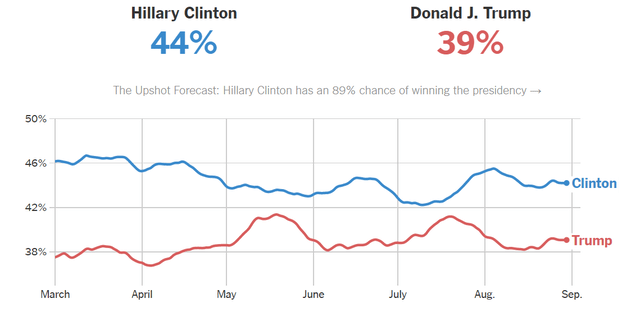
Here’s a smoothed out view of the year:


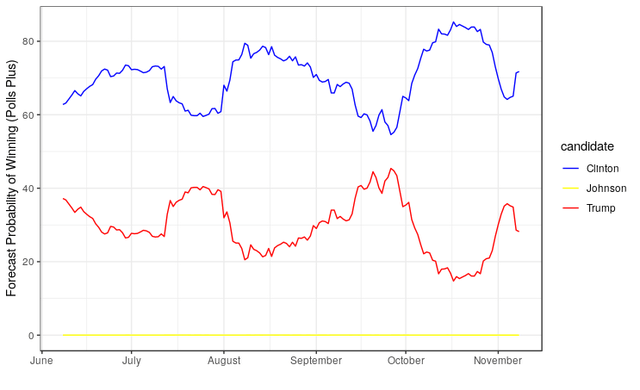
And here is the forecast probability of winning:


As I said above, there were wide swings in the race.


Before I go further, let me add into the mix this graph of the average deviation in polls depending on the time to the election:


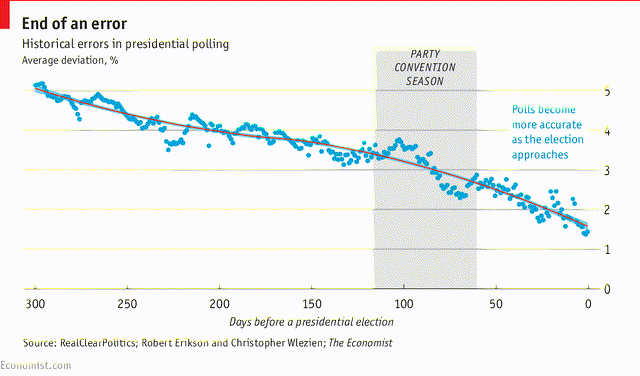
 As I write this, we are 43 days from the election, meaning that there’s an average of about 2.3% error in polling compared with the actual result.

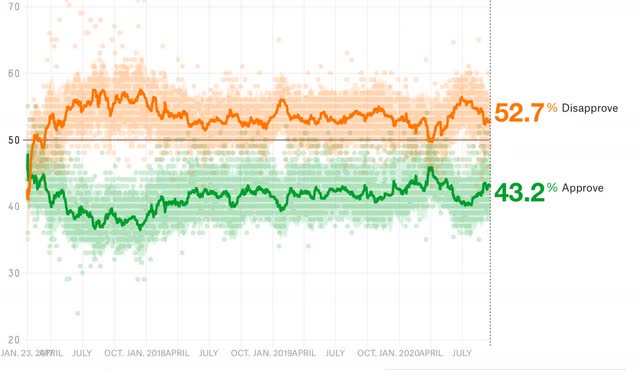
Now let’s compare that with 2020 so far. Here’s Nate Silver’s summary of national polling for the past 6 months:


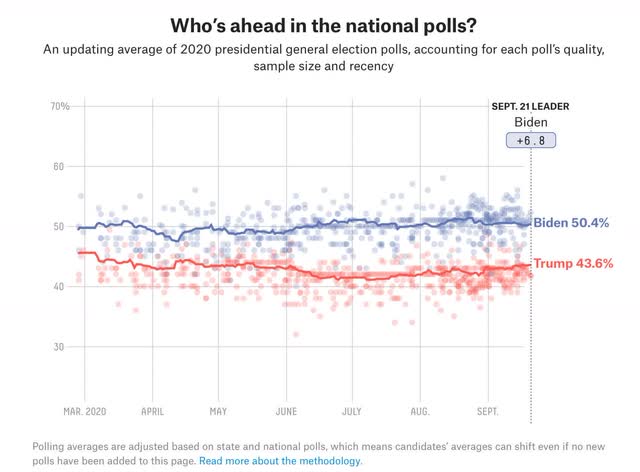
This has been a remarkably steady race for months on end. Even when Trump got the most benefit from his brief “rally round the flag” moment in early April, he still trailed Biden by 3.5%, 44.1% to 47.6%. For the past month, Biden has polled very close to 50% in either direction consistently.

In short, there’s every reason to believe that the polling this year is closer to the ultimate result than has historically been the case. I’m not even sure the thermonuclear bomb of Justice Ginsburg’s death is going to have much of an effect on the polling; at most I suspect it will increase the population of likely voters.

Sunday, September 20, 2020

The 2020 Presidential and Senate polling nowcast: shift in the control of the Senate to democrats looks increasingly likely


 - by New Deal democrat

Here is my weekly update on the 2020 elections, based on State rather than national polling in the past 30 days, since that directly reflects what is likely to happen in the Electoral College. Remember that polls are really only nowcasts, not forecasts. They are snapshots of the present; there is no guarantee they will be identical or nearly identical in early November.

Let’s begin with Trump’s approval. After several weeks of improvement, last week Trump’s approval eroded very slightly, and this week was virtually unchanged - and remains right in its normal range for the past 3 1/2 years:  


It is safe to say that Trump’s post-convention, “law and order” bounce has plateaued. There is no information yet as to how the passing of Justice Ruth Bader Ginsburg may impact the result. 

Here is this week’s updated map through September 19. To refresh, here is how  it works:

- States where the race is closer than 3% are shown as toss-ups.
- States where the range is between 3% to 5% are light colors.
- States where the range is between 5% and 10% are medium colors.
- States where the candidate is leading by 10% plus are dark colors.


KY and LA went from likely to solid Trump. Meanwhile Maine’s 2nd Congressional district went from toss-up to lean Biden.

While Biden’s “solid” plus “likely” Electoral College votes have declined from their peak of  302 seven weeks ago, this week they are at 284 from their low two weeks ago of 279.

I believe the public’s perception of both the economy and Trump’s handling of the pandemic have congealed. I do expect some further incremental improvement in Trump’s position as voters who were leaning GOP “come home.”

The passing of Justice Ginsburg can only be likened to igniting thermonuclear war over the Supreme Court. Intensity on both sides is going to be white hot, and turnout is likely to be even heavier, if that were possible. I do not dare predict at this time which side might *relatively* benefit at the polls.

Turing to the Senate, there have also been 4 changes this week, all but 1 benefitting the democrats:


MT and SC both improved from “lean GOP” to toss-up. GA’s second Senate seat moved from “likely” to “lean GOP.” Meanwhile KY moved from “likely” to “solid GOP.” Democrat donors who are contributing to Amy McGrath’s race against Mitch McConnell are lighting their money on fire; it would do much better good elsewhere.

At current polling, if Democrats win all those seats rated “solid” and “likely,” they will have 50 Senate seats; up to 56 with the “toss-ups,” and 57 if they were to capture the “lean GOP” seat. Shift in the control of the Senate is looking more and more likely.