From the Fed:Reports from the twelve Federal Reserve Districts indicate that the pace of economic activity has been slow in most Districts. Many described business conditions as "weak," "soft," or "subdued." Cleveland and St. Louis reported some weakening since their last reports while Boston and New York noted signs of stabilization. Kansas City reported a slight improvement.
Consumer spending was reported to be slow in most Districts, with purchasing concentrated on necessary items and retrenchment in discretionary spending. Districts reporting on auto sales described them as falling or steady at low levels. Tourism activity was mixed but received support from international visitors in several Districts, and the demand for services eased in most Districts. The transportation industry was also adversely affected by rising fuel costs. Manufacturing activity declined in most Districts but improved somewhat in Minneapolis and Kansas City. Most Districts reported that residential real estate markets remained soft. Commercial real estate activity was slow in most Districts, and some reported further slackening in demand for office and retail space. Most Districts reported easing loan demand, especially for residential mortgages and consumer loans; lending to businesses was mixed. Districts reporting on the agricultural sector noted some relief from drought conditions. Districts reporting on energy and mining activity recorded increased activity.
Almost all Districts continued to report price pressures from elevated costs of energy, food, and other commodities, although some noted that there have been declines or slower increases in prices for several industrial commodities and energy products. Business contacts in a number of Districts indicated that they had increased selling prices in response to the high costs for their inputs. Wage pressures were characterized as moderate by most Districts amid a general pullback in hiring, although several Districts noted continued strong demand for workers in the energy sector.
Note the words used to describe almost every economic area of activity -- soft, weak and declining. There is only one area of strength -- energy and mining. That alone should tell you a great deal about the current state of the economy.
Let's look a bit deeper into the report and the numbers:
Consumer spendingConsumer spending was slow in most Districts. Retail sales and other consumer spending was reported as mixed or little changed in Boston, Chicago, St. Louis, and Dallas and weak or declining in Philadelphia, Richmond, Minneapolis, and San Francisco. Sales were described as below expectations in Atlanta but on or close to plan in New York. Cleveland and Kansas City noted some improvement in retail sales since the last report. Several Districts reported that consumers were concentrating on food, staples, and other necessary items while reducing spending on discretionary items. Chicago, Dallas, and San Francisco reported noticeable declines in spending on apparel, electronics, and jewelry. Sales of furniture and household appliances were weak in most Districts. San Francisco described sales of this merchandise as exceptionally poor. A shift of consumer shopping patterns toward discount stores and lower-price brands and away from traditional department and specialty stores was observed in Philadelphia, Chicago, Dallas, and San Francisco. Sales of motor vehicles were reported to be weak or falling in all Districts, especially for larger, less fuel-efficient cars, SUVs, and trucks.
First of all, remember that consumer spending accounts for about 70% of US growth. So this perhaps the most important area of the report.
Given that, note things are not good for the US consumer. The sales pace is either, the same, mixed or declining. There was no talk of "robust" spending. Also note the consumer is concentrating his spending on staples rather than discretionary items. Durables goods (goods that will last longer than three years) are taking a hit as evidenced by the slow pace of furniture, household and automobiles. There is also a trend to discount stores, indicating further penny--pinching.
The bottom line is the US consumer is not very confident about the future.
To that end, here is a chart of personal consumption expenditures.
Note the year over year percentage change has been dropping for the last year.
Here is a chart of real (inflation-adjusted) retail sales
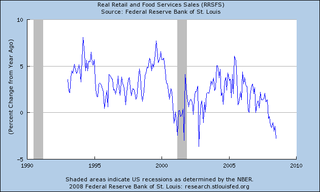
Note the year over year rate of change is now negative.
Non-financial servicesDistricts reporting on nonfinancial services generally indicated some slowing in activity since the last report, although New York reported stabilization after several months of decline. Boston, Cleveland, Atlanta, and Dallas noted falling demand for freight and transportation services, and firms in those industries reported higher fuel costs negatively affecting their margins. Dallas reported that airlines were reducing capacity. Demand for information technology services was reported to be flat in Boston and down in St. Louis. St. Louis and San Francisco noted less strength in the health care sector since the last report. Business and professional services activity was weakening in St. Louis and San Francisco. Dallas reported that business was steady at accounting firms but down at legal firms. Temporary staffing activity was reported to be mixed in Boston and Richmond and stable in Dallas.
Like the retail sales report, notice the adjectives used to describe overall activity. Activity is "slowing", demand is "falling", airlines are "reducing capacity", demand is "flat". Accounting firms are steady, but Dallas legal firms are down. There is no talk of expanding services or increases in employment to meet rising demand. Overall, the service sector is treading water. Here is a chart of the ISM service index:
Note activity is right around 50 which is the line the report uses to delineate between expansion and contraction.
manufacturingManufacturing activity was weak or declining in most Districts but improved in others. New York reported some stabilization after months of decline, Kansas City reported a rebound after a weakening in June, and Minneapolis and San Francisco have made gains since the last report. A number of Districts reported that export orders were bolstering manufacturing activity, but manufacturers in several of those Districts have noted some recent slowing in growth from this source. Boston, Philadelphia, Cleveland, Richmond, Chicago, and Dallas reported continuing declines in demand for housing-related products and construction materials. Boston reported declining output of aircraft and other transportation parts and equipment, but San Francisco reported a high rate of aircraft production.
Manufacturing has been a mixed bag for awhile now. While domestic demand has been slowing (see points made above) exports have been doing extremely well. In fact, they are one of the only bright spots for the US economy. In last week's GDP report, they were the primary reason for the 3.3% growth rate (along with an incredibly fortuitous mathematical anomaly) However, overall manufacturing activity is still hanging between expansion and contraction:
The ISM manufacturing index is hovering around the 50 level -- between expansion and contraction.

The year over year rate of industrial production has been dropping for about a year
The the Philadelphia Fed and the Empire States (New York Fed) manufacturing index have been very weak for the last 6 months or so.
HousingResidential real estate conditions weakened or remained soft in all Districts, except Kansas City, which reported a modest increase in sales since the last report. Demand for housing was reported to be still moving down in Boston, New York, Chicago, St. Louis, and San Francisco. Residential real estate activity was sluggish in Philadelphia, Cleveland, Richmond, Atlanta, Minneapolis, and Dallas. New York reported low levels of single-family construction but a brisk pace of multi-family construction after an increase in permits in June occasioned by a change in the New York building code effective July 1. Chicago reported a faster rate of decline in residential construction since the last report as well as delays and cancellations in residential building projects. Richmond and Kansas City reported that lower and mid-price houses were selling at a better rate than more expensive houses. Atlanta and Dallas reported that inventories of unsold new houses were edging down.
Here's the bottom line with housing. Inventory of existing homes is at a record in both
absolute (total number available) and months of supply. As a result, prices are still dropping at a high
year over year levels. On top of that, the US consumer is pulling in his spending ways, adding further pressure to the market. Finally, credit is tightening. Massive inventory + depressed consumer + tighter credit = a real estate market that isn't going to recover anytime soon.
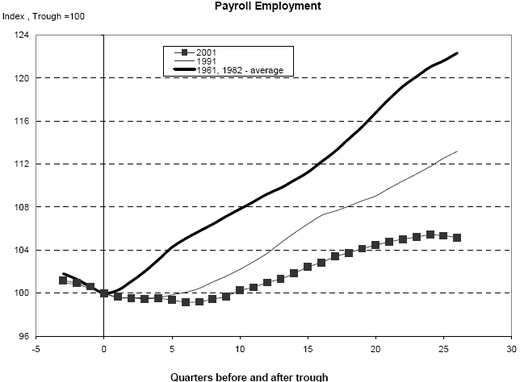
EmploymentThe report does not have a separate employment section, but I wanted to add the following information:
The year over year rate of employment growth has been declining for almost two years and is now moving into negative territory, and
The unemployment rate has been increasing for about a year and a half.
The bottom line is simple: the economy is in terrible shape.