Saturday, November 10, 2012
Weekly Indicators: maximum hurricane impact edition
- by New Deal democrat
The monthly economic news this week was sparse. Consumer confidence rose to a 5 year high. The expectations component of this is an element of the LEI. The ISM services index showed slightly less expansion. Manufacturing inventories increased slightly. Consumer credit expanded less.
Many of the high frequency weekly indicators this past week were affected by Hurricane Sandy, so they must be treated with lots of skepticism. After one more week, the influence of the hurricane shuold pass.
Same Store Sales and Gallup consumer spending varied from weakly positive to substantially negative, although Gallup is almost certainly due to the hurricane:
The ICSC reported that same store sales for the week ending October 26 fell -0.2% w/w and were up +1.4% YoY. Johnson Redbook reported a very weak 0.8% YoY gain. Johnson Redbook has consistently been lower than the other series for consumer spending. The 14 day average of Gallup daily consumer spending as of November 8 was $65, compared with $71 last year for this period. This is the worst showing in a long time for Gallup, and would probably have been poor anyway, but Hurricane Sandy almost certainly impacted this number.
Bond yields were mixed and credit spreads reamined close to their recent lows:
Weekly BAA commercial bond yields declined -0.05% this week to 4.49%. Yields on 10 year treasury bonds fell -0.07% to 1.74%. The credit spread between the two increased by 0.01% to 2.75%, just off its 15 month low. This remains an excellent trend, as it demonstrates a lack of fear of corporate default.
Housing reports were generally positive although weakly so:
The Mortgage Bankers' Association reported that the seasonally adjusted Purchase Index fell -5% from the prior week, but is still up 3% YoY. These remain in the upper part of their 2+ year range. The Refinance Index also fell -5% for the week, retreating further from recent multi-year highs.
The Federal Reserve Bank's weekly H8 report of real estate loans this week rose by 3 to 3531, or +0.1%. The YoY comparison, however, fell slightly to +1.3%, and is also 1.5% above its bottom.
YoY weekly median asking house prices from 54 metropolitan areas at Housing Tracker increased +1.2% from a year ago. YoY asking prices have been positive for over 11 months, although this is the weekest YoY comparison in many months.
Money supply remains generally positive:
M1 was up +0.5% for the week, and increased +3.5% month over month. Its YoY growth rate declined slightly to +13.7%. As a result, Real M1 also declined to +11.7% YoY. M2 was up +0.4% for the week, and was up 0.8% month over month. Its YoY growth rate increased slightly to 7.3%, so Real M2 also rsoe slightly to 5.3%. The growth rate for real money supply is still quite positive.
Employment related indicators were neutral to positive:
The Department of Labor reported that Initial jobless claims declined 8000 to 355,000 from last week's unrevised 363,000. The four week average rose by 3250 to 370,500, 2% above its post-recession low.
The American Staffing Association Index was again level at 95, the same level at which has been for about 2 months. The sieways trend in this index is similar to last year.
The Daily Treasury Statement showed that for the first 6 days of November, $42.5 B was collected vs. $ 40.6 B a year ago, a $1.9 B or increase. For the last 20 days ending on Thursday, $133.5 B was collected vs. $128.8 B for the comparable period in 2011, a gain of $4.7 B or +3.6%. This is towards the weak end 20 day YoY comparisons.
Rail traffic remained negative YoY, but still due to coal, while the diffusion index decreased considerably:
The American Association of Railroads reported that total rail traffic was down -34,900 carloads YoY, or -6.5%. Non-intermodal rail carloads were again off a large -6.8% YoY or -20,200, once again entirely due to coal hauling which was off -21,300. Excluding coal, carloads were up 1100, but it is possible this was affected by preparations for the anticipated landfalling hurricane in the northeast. Negative comparisons remained even at 11 types of carloads. Intermodal traffic was down -14,500 or -6.3% YoY.
Finally, the price of oil rose while gasoline fell, and gasoline usage was mixed:
Gasoline prices fell another $.08 last week to $3.49. This is nevertheless still quite high for this time of year. Oil prices per barrel increased from $84.86 to $86.07. Gasoline usage for one week was 8307 M gallons vs. 8671 M a year ago, down -4.2%. The 4 week average at 8593 M vs. 8572 M one year ago, was actually up 0.2% YoY.
Turning now to the high frequency indicators for the global economy:
The TED spread remained just above its 52 week low, 0.22. The one month LIBOR also remained at its new 52 week low of 0.2090. Both are well below their 2010 peaks.
The Baltic Dry Index fell from 986 to 940, well above its recent 52 week low of 662. The longer term declining trend in shipping rates for the last 3 years remains. The Harpex Shipping Index fell by 4 to 367, another new 52 week low.
Finally, the JoC ECRI industrial commodities index rose from 118.21 to 118.99. It turned slightly positive, up +0.10.
Housing, money supply, bank overnight rates, and corporate yields and credit spreads all remained very positive. Jobless claims were neutraland. Gas prices are for now a positive. Other commodities are neutral.
Meanwhile rail carloads, shipping rates, and gas usage remain generally negative and continue to the contrast between transportation and other indicators.
Too many series were affected by Hurricane Sandy to read much into this week's data. The effects should begin to recede next week. Have a nice weekend.
Friday, November 9, 2012


The Slowing South Korean Economy
As China has slowed, so have the surrounding economies. South Korea presents a good example.

The percentage change from the previous quarter has been slowing down for teh last 8 quarters, with a more pronounced slowdown over the last four. The big reason for this is the marked slowdown in investment, which has been negative in four of the last 5 quarters. This would have been five had it not been for a big investment in facilities in 1Q12 -- which is probably a one off figure.

Also note that we see negative numbers in two key economic areas: manufacturing -- which has printed negative growth in three of the last four quarters and construction -- which has also printed negative growth in three of the last four quarters.

The year over year figures also highlight the slowdown. First, notice the overall YOY growth rate has slowed in each of the last three quarters, falling from 2.8% in the first quarter to 1.6 in the third. Second, note the accelerated slowdown in three key areas over the last three quarters: manufacturing, construction and exports.
These are not the kind of growth numbers any central bank wants to see for their economy.
A note about "democracy" in America
- by New Deal democrat
We now know just how significant the effect of gerrymandering was in the 2012 elections for the House of Representatives.
Democratic candidates received a total of 53.95 million votes, or 50.26%. Republican candidates received a total of 53.40 million votes, or 49.74%.
Despite this, the likely make-up of the next House of Representatives is going to be 200 Democrats (46%) and 235 Republicans (54%).
Over the weekend I plan on arguing that there are 4 desparately needed amendments to the US Constitution, and that those amendments should be initiated by the State Legislatures as permitted by the Constitution if the Congress will not act.
Morning Market Analysis


The 60 minute TLT chart (top chart) shows that the TLTs broke through resistance around the 124.5 area. But on the daily chart (lower chart) notice prices printed a very strong bar yesterday on very high volume. The MACD has also given a buy signal. This is a flight to safety, plain and simple.

the GLD ETF continues its rebound, although yesterday's volume is disappointing for the bulls. Bow prices are above all the EMAs with the next level of resistance the Fib fan just above 168.

The homebuilding sector has fallen through support just below the 26.5 level with the next logical price target the 50 day EMA. However, notice the rising CMF. This looks like a temporary sell-off that's in sympathy with the larger market as a whole.

The Russian market has broken its nearly 6-month trend line and is now below all the EMAs. The shorter EMAs have crossed below the 200 day EMA. The MACD is moving lower and the CMF is negative. Put succinctly, this is a chart that wants to move lower.
Thursday, November 8, 2012
Bonddad Linkfest
- Overtures on debt deal (WaPo)
- Obama's coalition (WaPo)
- Republicans face a difficult future (WaPo)
- BOE keeps rates at .5% (BOE)
- ECB keeps rates unchanged (ECB)
- Greece approves austerity (FT)
- Day after election DOW performance means nothing (Marketwatch)
- Jobless recoveries and the disappearance of routine occupations (Thoma)
- FT on the ECB's decision (FT)
- BOE halts bond buying; may try to stimulate lending (BB)
Tax Reform is Easy: Try This Plan
Everyone (on both sides of the aisle) loves to talk about how we need tax reform to both broaden the base and increase locked up growth potential and yet we can never seem to even get reform started. So, I thought, why not lay out a real simple tax reform plan that both sides should be able to get their arms around just as an example of how easy this really should be (of course, I live in a world without lobbyists or wealthy patrons to please).
First, Speaker of the House John Boehner yesterday offered up his cooperation with the line that if Reagan and Tip O'Neill could do tax reform, so could he. I think this provides us with our starting point to get the President on board, as a key feature of the Reagan/O'Neill Reform was to treat capital gains and dividends as ordinary income (albeit at a lowered top rate). I believe that if Republicans are willing to put this on the table it would make major tax reform politically possible and really enable potential marginal rate decreases.
So again, assuming my world of no lobbyists and one where Boehner puts dividens/capital gains on the table, here is my plan in 5 easy steps:
1) As above, treat capital gains and dividends as ordinary income.
2) Cap charitable giving at 10% of income (ie a tithe).
3) Eliminate the mortgage interest deduction through a 5 or 10 year phaseout (ie 10/20% of value lost each year until it is gone). If there is ever a time to get rid of the mortgage interest deduction it is right now with 3.5% 30 year mortgage rates.
4) Phase out state and local tax deductions over a ten year period. There is no reason we should subsidize those who want to live in high tax/cost areas at the expense of those who don't (and yes, that is how it works).
5) Phase out the child tax credit over ten years (ie $100/year).
The tax exemption for employer provided health insurance would stay (its elimination would be way too regressive), but I would eliminate most other "minor" deductions in order to get more rate savings (and simplicity in the code).
The end rates would vary (and would actually decline each year through the phaseouts) depending on how much of the eliminated tax expenditures would be used to lower rates vs raise revenue (Simpson-Bowles used a 90-10 split, with 90% going to lower rates). I would also suggest we go down to 3 brackets (say up to $100k, 101k-999K, and over $1 million) to keep things simple. Obviously, there would be some standard deduction/exemptions still in play for those that don't itemize (which would be almost everyone in 10 years) and to keep the code more progressive .
Seems to me this could be a pretty easy basis for tax reform that would allow for economic adjustments due to the gradual nature of the phaseouts.
The UK's Growth Problems (or, Thank God For the Olympics)

The above chart is from the latest release of UK GDP. Notice the black line which is total GDP. It has essentially been flat for the duration of the recovery. In fact, the only major change that we see of all the various components is a bump in construction in 2010 and 2011.

The above chart highlights the basic problem. First, note the continual negative reading in production for the last 7 quarters. Before that, we see growth at very low levels, indicating production is barely growing at all. Next, note that construction has contracted for the last three quarters -- and at a fairly strong clip. Finally, services have been just barely growing over the last 8 quarters.
Morning Market Analysis
Given yesterday's sell-off -- and it's proximity to the election -- let's take a look at the US equity market over a series of several charts.
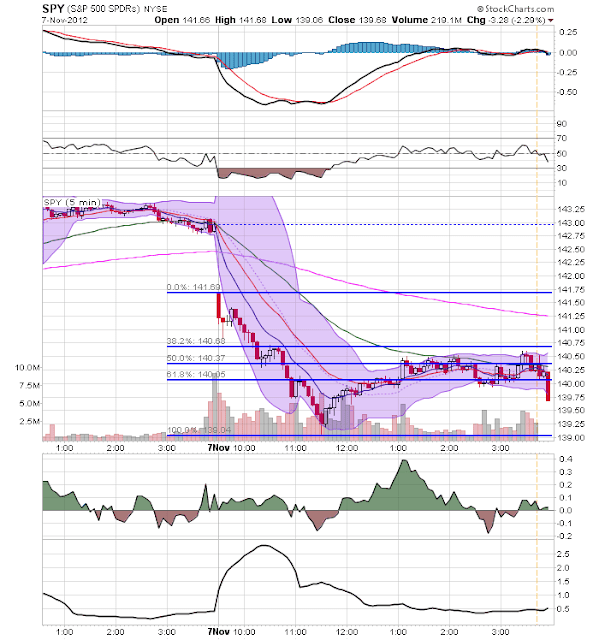
On the 5-minute chart, we see that prices gapped lower at the open, moved lower until lunch and then rallied until the close. The rally was stalled by the natural resistance that occurs at Fib levels. Look closely at the volume over the rally, which was lower than the sell-off. Also note the smaller candles and less severe nature of the rally. My guess is this is a technical purchasing rally.

On the 60 minute chart, notice that prices have fallen below the key support level of 141, which was established multiple times over the last two weeks.

On the daily chart, we see the importance of the 141 price level. Also note that prices have sold-off to Fib levels on very high volume. Also note the weakening MACD and CMF. On this chart, I'd target the 200 day EMA as the next price target.


The weekly chart (top chart) shows that prices are right at important support. The MACD is close to giving a sell-signal, the the CMF is strong. The monthly chart (bottom chart) is very concerning, as it indicates that prices are right at support for the long-term rally that started in 2011.
Wednesday, November 7, 2012
Three lessons from yesterday's election
- by New Deal democrat
Regular economic blogging will resume shortly. I can't let the election pass without noting a few Big Picture items:
1. The "Whistling Past Dixie" majority is here.
Obama won when Ohio was called by all the networks at about 11:20 p.m. EST. At that time Obama hadn't won even one state in the Confederacy. As I type this, Florida is still out, and Virginia was just the icing on the cake. Looking at past electoral college results, this is the first time since 1924 - 88 years ago - that Dixie has voted uniformly for one candidate, and that candidate has still lost. This is a major shift in electoral politics, even more dramatic than in 2008, and likely to endure (obviously not in every election) for at least a generation.
2. The "tea party" has cost the GOP the Senate.
The GOP lost at least 4 easy Senate pick-ups between 2010 and 2012. By nominating right wing purists (or nutcases) in Nevada (Sharron Angle) and Delaware (Chris MacDonnell) in 2010, and Todd Akin (Missouri) and Richard Mourdock (Indiana) in 2012, the GOP threw away 4 easy seats. In each case a more "pure" social conservative defeated a traditional GOP conservative in the primary (e.g., Tom Carper in Delaware, Richard Lugar in Indiana), and then lost the general election. As a progressive, I hope the GOP learns no lesson whatsoever from this.
3. The balance of power on the Supreme Court is likely to change.
Two of the five reactionary Supreme Court Justices are in their late 70's. Both Justices Scalia and Kennedy are 76 years old. It's likely that Obama will have the chance to replace at least one of them in the next four years. Obama will appoint a moderate or liberal to replace them. For the first time since 1969, the Court will begin to move to the left.
These are still the beginings of several trends that will take decades to play out. The GOP's "southern strategy" began in 1968 and was wildly successful through 2004. The "Whistling past Dixie" majority is still in its early stages.
P.S.: In the most underreported vote last night, with possibly the biggest long-term impact on the country, Puerto Rico voted in favor of statehood. In a two-step referendum, 54% voted to change the island's status with the US, and then 61% voted to become a US state. The referendum is not binding on the Congress, and I don't see the GOP House honoring it, but this is a Big Effing Deal.
-----------------
From Bonddad
Let me add my two cents (inflation adjusted, of course).
Being a creature of habit and routine, I've had a regular dinner at the same restaurant for the last 10 years (literally). It's in an area of Houston that has a very good school system, so it attracts families. Over that time, I've seen the customer make-up change drastically. The biggest difference is that whites are now a minority. Obama won without a majority of the white vote for the second time. That's a huge change and represents a vast difference in US politics.
To continue, the next states that will become swing states are Arizona and Texas. Both have growing Hispanic populations which will soon outnumber whites. And the Republican party has done nothing but completely antagonize this population for the last 10 years. Several states have passed bills that deal with asking for papers to prove citizenship. This even got on Gabriel Iglesias' nerves -- so much so that he wanted to play a joke on the entire state. When you've gotten Fluffy to become political, you've really crossed a line.
Lindsay Graham said it best:
"The demographics race we're losing badly," Sen. Lindsey Graham (R-SC) told the Washington Post. "We're not generating enough angry white guys to stay in business for the long term."
I've written this before, but I think it bears repeating. This was Romney's election to lose. The economy was weak, and Obama was not in a strong position. Yet Romney did lose. And that should terrify Republicans badly. The question is, why? And the answer is the Republican base pulled all the candidates to the political right of Stalin during the primary season, giving the Obama campaign ample fodder during the election. Think about all the lines the Democrats used against the Republicans that Romney uttered during the primary contests: "Planned Parenthood, we'll get rid of that;" "I object to FEMA;" etc...
In addition, none of the Republican candidates looked reasonable. Instead, they all looked nuts, literally trying to outdo each other with their own brand of crazy. Herman Caine's slogan was the equivalent of a pizza commercial, Michelle Bachman thinks vaccines cause autism, Rick Perry can't get a complete sentence out ... the list goes on. Not one of these people were serious people who a rational person could trust with true power.
I think one of the biggest reasons for this is the anti-science/anti-intellectual bent of the current Republican leadership. Remember Rick Santorum's "the president is a snob because he wants people to go to school" line? From denouncing global warming (ask New York if that's just a theory) to arguing for the teaching of creationism to the banning of studies that disprove a central tenant of your platform, the Republicans have been at war with facts, figures and data for a number of years. And the end result is that stupid is winning. Consider that only 6% of scientists identify as Republicans.
The Republicans have a lot of soul searching to do right now. If they continue on their current path, they will only be able to attract uneducated whites -- a declining population. That's not exactly what you want your base to be.
Morning Market Analysis

Yesterday, the oil market made an extremely strong move on high volume. Prices advanced through the 10 and 20 day EMA and touched the upper resistance line. Advances like this are important as they would indicate a change in overall sentiment.


The 60 minute dollar chart (top chart) shows that the 21.95 price level was providing important resistance to the dollar chart. The daily chart (bottom chart) shows that prices consolidated between the 21.5 and 22 price level. They have since broken out, advancing above the 50 day EMA.

Industrial metals are still trading in a range between the 17.5/18 level and 20/21 level. Until this chart shows more bullish developments the economy won't be ready to move into a higher GDP position.


After falling from the 174 area top chart), gold rebounded yesterday, bouncing off the 50 day EMA and price levels established in mid-August. The weekly chart (bottom chart) shows that prices are in fact trading in a range between 150 and 174.
Tuesday, November 6, 2012
About the New Found Chinese Manufacturing Growth ....
Last week, the market received some positive news from China:
China’s manufacturing PMI came in at 50.2 in October. For the first time in three months, the index reading was higher than the neutral level of 50, indicating that the manufacturing sector in China has expanded again.
However, let's look at the last six months of reports:

The "50" line is the difference between contraction and expansion. For the last six months, the figure has fluctuated right around a 50 reading, indicating that the manufacturing sector is right between expansion and contraction.
While this report did have some strong internals, the net overall impact/effect is not that great. In addition, consider the latest report from HSBC:
After adjusting for seasonal factors, the HSBC Purchasing Managers’ Index™ (PMI™) – a composite indicator designed to give a single-figure snapshot of operating conditions in the manufacturing economy – posted 49.5 in October, up from 47.9 in September, to signal a full year of monthly deteriorations in Chinese manufacturing sector operating conditions. However, with the PMI at an eight-month high, the latest data indicated the rate of deterioration was marginal.
Here's their data in chart form:

In short, this is hardly news to start a new bull run on. At least, not yet.
Five graphs for election day
- by New Deal democrat
Here are five economic graphs that I think are going to prove dispositive today.
First of all, Gallup economic confidence:
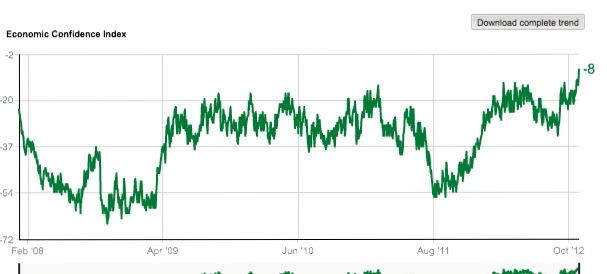
Note the sudden and dramatic upturn in the last couple of months, to the highest reading since the Great Recession began back in 2008.
Second, University of Michigan consumer sentiment:
This confirms the recent upswing in average Americans' belief that the economy is healing.
Third, the employment to population ratio among 25 to 54 year olds:
One reason for the upswing in confidence may be that population adjusted employment in the critical voting age group has finally borken out of flatlining. Note that this too, which excludes retiring Boomers, has finally had an upswing since the end of last year and is clearly at a post-recession high.
Fourth, Case Shiller house prices:
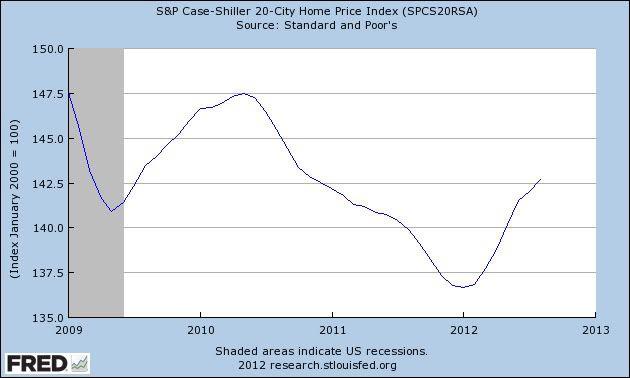
Another important reason for the upswing in confidence may well be that Americans are finally satisfied that the value of their houses isn't continuing to plummet, and at least a little equity is being clawed back.
Finally, the unemployment rate:
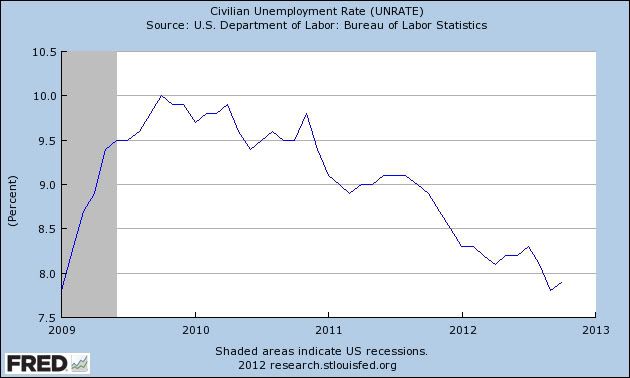
The unemployment rate has slowly but steadily declined for three years, finally breaking under 8% a month ago.
When I saw the 7.8% unemployment rate a month ago, I wrote that democrats could stop wringing their hands, Obama would win. I knew he was smart enought not to repeat his somnolent performance in the first debate, and it would fade as a story in the month remaining before the election. Meanwhile, the five above graphs show that Obama's economic performance has been just good enough to push him over the finish line.
Morning Market Analysis

Oil continues to move downward, albeit slightly. Notice the bearish orientation of the EMAs -- the shorter are below the longer and all are moving lower. Prices are also below all the EMAs. Finally, we have decreasing momentum and a slightly negative CMF reading.


After breaking through resistance, both semi-conductors (top chart) and homebuilders (bottom chart) have consolidated gains. The big key for the semi chart is to get above the 200 day EMA.


On the daily chart (top chart) notice the German market broke trend in early September and has since been trading sideways, remaining above key support -- which is just about the 22 handle. On the weekly chart (lower chart) notice that upward momentum stalled at the 61.8% Fib level. A move above this level shows there's a lot of daylight for a rally.
Monday, November 5, 2012
Bonddad LInkfest
- The looming GOP civil war (Politico)
- Lessons learned from 2012 (Politico)
- China's services index at 50.5 (Markit)
- UK services expand slightly (Markit)
- EU loans see biggest drop since 2009 (BB)
- Indonesia grows 6% (BB)\
- S&P guilty of misleading investors (FT)
- Turkey raised to investment grade (FT)
- Bank of India policy review (RBI)
Is A Stronger Recovery Coming?
The last four years are actually fairly typical of a post-financial crisis recession. The overall economic system was burdened with too much debt that had to be paid down (for the latest on this, see this post from NDD). However, there are several positive signs that the worst is over.
From Bloomberg:
No matter who wins the election tomorrow, the economy is on course to enjoy faster growth in the next four years as the headwinds that have held it back turn into tailwinds. Consumers are spending more and saving less after reducing household debt to the lowest since 2003. Home prices are rebounding after falling more than 30 percent from their 2006 highs. And banks are increasing lending after boosting equity capital by more than $300 billion since 2009.
“The die is cast for a much stronger recovery,” said Mark Zandi, chief economist in West Chester, Pennsylvania, for Moody’s Analytics Inc. He sees growth this year and next at about 2 percent before doubling to around 4 percent in both 2014 and 2015 as consumption, construction and hiring all pick up.
.....
Hiring in the U.S. increased more than forecast in October as employers looked past slowing global growth and political gridlock at home. In the last jobs report before tomorrow’s election, the Labor Department said a net 171,000 workers were added to payrolls, beating the 125,000 median forecast of economists surveyed by Bloomberg.
.....
Households seem increasingly inclined to side with the optimists, preferring to see the economic glass as half-full rather than half-empty. Consumer confidence climbed in October to a more than four-year high as Americans took comfort from an improving job market, according to figures from the New York- based Conference Board.
.....
While U.S. sales of cars and light-duty trucks will suffer temporarily from the disruption caused by Hurricane Sandy, the industry “will have a strong fourth quarter and continue growing next year,” Kurt McNeil, vice president of U.S. sales for General Motors Co. (GM) in Detroit, said in a Nov. 1 conference call with analysts.
Easier credit terms are contributing to the rise in consumer spending. Banks reported that they continued to ease standards on auto loans and credit cards last quarter, according to a Fed survey of senior lending officers.
End Excerpt
For me, the big issue has been the rebound in the housing market which has been occurring all year. The inventory/sales ratio is now far more in line with its historical average. NDD has been focusing on this as well, with both of us agreeing that a bottom is probably in.
Also consider the paying down of household debt and the improving auto sales picture. Both of these indicate that households are getting on a far firmer financial footing, thereby allowing them to spend more. And considering the personal consumption expenditures on durable goods are still strong, it appears that households are more confident in the future.
The big wild card we now face is the fiscal cliff. Of course, we should probably get through the election before we start worrying about that.
The US Manufacturing Slowdown
Thanks to a recession in the EU and a slowdown in China, the US manufacturing is slowing down. Let's first look at the macro-level numbers.


Overall industrial production (top chart) has stalled for the last nine months, while capacity utilization has done so over the last 10 months.

The latest ISM report shows two months about the 50 level, which is the line between expansion and contraction. However, the internals of the report were not that great. Consider that 8 of 18 industries were expanding while 8 were contraction and 2 were neutral. Those are not the type of numbers that indicate strong growth. Also consider the anecdotal information from the report:
"Market is still very soft." (Paper Products)
"Business is picking up." (Furniture & Related Products)
"[Our] 4th quarters usually begin to show a slowdown in demand, and this year is no different; prices are also dropping." (Wood Products)
"Demand down slightly due to customers pre-buying ahead of announced material price increases." (Plastics & Rubber Products)
"The slowing of capital expenditure in Europe and China has lowered our backlog for Q4." (Computer & Electronic Products)
"We see a general softening in the steel and automotive markets in the fourth quarter." (Fabricated Metal Products)
"Cuts in healthcare reimbursement rates continue to negatively affect top-line revenue." (Miscellaneous Manufacturing)
"Business conditions stable to slightly improving." (Transportation Equipment)
"Sales and order intake have slowed." (Primary Metals)
"Europe is still very much a concern. Global recovery is still fragile." (Chemical Products)
I've emboldened the negative comments, which comprises the majority of those listed. Two deal specifically with international issues while others simply note a slowdown in orders.
Let's look at two more data sets from the ISM report:

The new orders index as printed two months of positive numbers. However, before that the chart shows three months of contraction, making the last five months pretty much a statistical wash.

The overall production index printed a positive number in the last report, but that was the first number in three months. And, like the new orders index, the overall level for the last five months is a statistical wash.
Also consider this information from the latest Beige Book:
Conditions in the manufacturing sector were mixed since the last report, though on balance, more Districts reported that conditions had improved than worsened. The Boston, Richmond, Atlanta, St. Louis, Kansas City, and San Francisco Districts reported that activity expanded, though growth was generally seen as modest. Activity was reported as mixed in the Dallas District, while the New York, Chicago, and Minneapolis Districts reported that activity weakened, though declines were mild for the latter two. Significant gains in manufacturing related to the construction, energy, and transportation sectors were reported across several Districts, with particularly robust gains tied to the automotive industry. There were exceptions in the Kansas City and Dallas Districts where manufacturing related to transportation equipment was reported as mixed.
Steel production was said to be flat in the Cleveland and San Francisco Districts, and lower in the St. Louis District. Activity related to machinery and equipment was reported as lower in the Philadelphia, Chicago, and Kansas City Districts. Weaker sales growth in the high tech industry was reported by Dallas, and Kansas City said that growth among high-tech firms remained sluggish in its District. The Boston District noted some weakness in the semiconductor industry, while the San Francisco District said that new orders from the semiconductor industry had improved. Manufacturing contacts in the St. Louis District were tentative about the outlook for 2013, and contacts in the Dallas District noted some uncertainty about the outlook due to the upcoming election.
While the first paragraph notes growth, it's modest. However, the second paragraph notes several areas of weakness. In short, it's a very mixed report.
Morning Market Analysis


All of the major US equity indexes are now in a technical correction. It began with the IWMs, who's correction started in mid-September. This was followed by the QQQs at the beginning of October and now the SPYs at the beginning of November. The technical key is the IWM chart, which is currently at long-term support. A break of this trend would lead to the 200 day EMA being the next logical price target. Both the QQQs and SPYs are also at important technical support levels, although theirs are Fib levels.


The above charts are the real key to the equity markets. All are weekly treasury market charts of various sections of the curve. While all have broken some upward sloping curve recently, none of sold-off in a major way. Hence, there is no major risk based cash to flow into the equity markets. Until we see a big move out of treasuries, the equity markets will have problems moving higher.
Subscribe to:
Posts (Atom)