Bonddad is doing something new and unique -- I am taking a vacation. This is the first vacation I have taken in, well, a really long time. Between a law practice, graduate school, blogging, family commitments and getting married in May I am pretty tired and need to recharge my batteries for the Spring.
Where am I going? That's is ultra-top secret. I can tell you it involves sunshine, tanning lotion and the company of the future Mr$. Bonddad. We are going somewhere near the equator.
Over the last week -- thanks in no part to me but an incredibly chaotic market -- readership has jumped. So this vacation comes at a rather inopportune time for the blog. For those of you who are new I would ask that if you like this blog to please come back when I return, fully charged and ready to deal with the insanity of the markets again.
For those of you who need an economics/market fix, I would recommend all of the links on the right side of my blog. I read them everyday and find them all useful and informative.
So, I will return again a week from Monday, where I will probably start with charts and graphs (what else?) of the previous week.
Saturday, January 26, 2008
Friday, January 25, 2008
Weekend Haggis
You're probably expecting pictures of a Beagle and two Weimeraners, aren't you? Well, today we're going to do something a bit different. Last Saturday, Bonddad and the future Mr$. Bonddad were at the Burns supper. This was my first and it was a ball. And we feasted on Haggis. But before the pictures of the Haggis, here is the poem to the Haggis:
Fair fa' your honest, sonsie face,
Great Chieftan o' the Puddin-race!
Aboon them a' ye tak your place,
Painch, tripe, or thairm:
Weel are ye wordy of a grace
As lang's my arm.
The groaning trencher there ye fill,
Your hurdies like a distant hill,
Your pin wad help to mend a mill
In time o' need,
While thro' your pores the dews distil
Like amber bead.
His knife see Rustic-labour dight,
An' cut you up wi' ready slight,
Trenching your gushing entrails bright
Like onie ditch;
And then, O what a glorious sight,
Warm-reekin, rich!
Then, horn for horn they stretch an' strive,
Deil tak the hindmost, on they drive,
Till a' their weel-swall'd kytes belyve
Are bent like drums;
Then auld Guidman, maist like to rive,
Bethankit hums.
Is there that owre his French ragout,
Or olio that wad staw a sow,
Or fricassee wad mak her spew
Wi' perfect sconner,
Looks down wi' sneering, scronful' view
On sic a dinner?
Poor devil! see him owre his trash,
As feckless as a wither'd rash,
His spindle shank a guid whip-lash,
His nieve a nit;
Thro' bluidy flood or field to dash,
O how unfit!
But mark the Rustic, haggis-fed,
The trembling earth resounds his tread,
Clap in his walie nieve a blade,
He'll mak it whissle;
An' legs, an' arms, an' heads will sned,
Like taps o' thrissle.
Ye Pow's wha mak mankind your care,
And dish them out their bill o' fare,
Auld Scotland wants nae shinking ware
That jaups in luggies;
But, if you wish her gratefu' pray'r,
Gie her a Haggis! *
* This stanza was originally written out as follows:-
"Ye Pow'rs wha gie us a' that's gude
Still bless auld Caledonia's brood,
Wi' great John Barleycorn's heart's bluid
In stoups or luggies;
And on our boards, that king o' food,
A gud Scotch Haggis!"
And here are the pictures of our meal:


Anyway -- the markets are closed. Do anything except think about economics and the markets.
I'll be back tomorrow with a weekly wrap.
Fair fa' your honest, sonsie face,
Great Chieftan o' the Puddin-race!
Aboon them a' ye tak your place,
Painch, tripe, or thairm:
Weel are ye wordy of a grace
As lang's my arm.
The groaning trencher there ye fill,
Your hurdies like a distant hill,
Your pin wad help to mend a mill
In time o' need,
While thro' your pores the dews distil
Like amber bead.
His knife see Rustic-labour dight,
An' cut you up wi' ready slight,
Trenching your gushing entrails bright
Like onie ditch;
And then, O what a glorious sight,
Warm-reekin, rich!
Then, horn for horn they stretch an' strive,
Deil tak the hindmost, on they drive,
Till a' their weel-swall'd kytes belyve
Are bent like drums;
Then auld Guidman, maist like to rive,
Bethankit hums.
Is there that owre his French ragout,
Or olio that wad staw a sow,
Or fricassee wad mak her spew
Wi' perfect sconner,
Looks down wi' sneering, scronful' view
On sic a dinner?
Poor devil! see him owre his trash,
As feckless as a wither'd rash,
His spindle shank a guid whip-lash,
His nieve a nit;
Thro' bluidy flood or field to dash,
O how unfit!
But mark the Rustic, haggis-fed,
The trembling earth resounds his tread,
Clap in his walie nieve a blade,
He'll mak it whissle;
An' legs, an' arms, an' heads will sned,
Like taps o' thrissle.
Ye Pow's wha mak mankind your care,
And dish them out their bill o' fare,
Auld Scotland wants nae shinking ware
That jaups in luggies;
But, if you wish her gratefu' pray'r,
Gie her a Haggis! *
* This stanza was originally written out as follows:-
"Ye Pow'rs wha gie us a' that's gude
Still bless auld Caledonia's brood,
Wi' great John Barleycorn's heart's bluid
In stoups or luggies;
And on our boards, that king o' food,
A gud Scotch Haggis!"
And here are the pictures of our meal:
Anyway -- the markets are closed. Do anything except think about economics and the markets.
I'll be back tomorrow with a weekly wrap.
Banks Need a Ton of Cash In Case of Insurers Downgrades
From Bloomberg:
I haven't written anything on the bond insurers problems, largely because there are so many issues to write about it's hard to pick and choose. However, the issues surrounding the bond insurers are huge and could pose a huge problem if these companies go belly-up or are downgraded as the story above illustrates.
Banks may need to raise as much as $143 billion to meet regulators' requirements should rating firms downgrade bond insurers, Barclays Capital analysts said.
Banks will need at least $22 billion if bonds covered by insurers led by MBIA Inc. and Ambac Financial Group Inc. are cut one level from AAA, and six times more for downgrades by four steps to A, Paul Fenner-Leitao wrote in a report published today. Banks own $820 billion of structured securities guaranteed by bond insurers, the report said.
``This is a huge amount, but the assumptions we use are also very aggressive,'' Fenner-Leitao in London said in a telephone interview. The estimate shows how bank capital could be diminished in the event of significant downgrades, he said.
I haven't written anything on the bond insurers problems, largely because there are so many issues to write about it's hard to pick and choose. However, the issues surrounding the bond insurers are huge and could pose a huge problem if these companies go belly-up or are downgraded as the story above illustrates.
What Inflation?
From the WSJ:
Bernanke is in a terrible spot. He basically gets to either clean-up Greenspan's mess or try an reflate the economy in some measure to prevent pain. The problem is Greenspan's mess is wide and deep and therefore hard to clean-up and there are no more assets to inflate.
What Ben should have done from the beginning is to say the following: "Alan left a big damn mess that is going to take a long time to clean up. There is no getting around the fact that some pain will be felt. However, what we can do is make sure the economy does not completely spin out of control by keeping prices somewhat stable."
The problem with the previous plan is twofold: it's really hard to do and we're in the middle of an election year. So, the interest rate cuts will come fast and deep. This is leading some to question Bernanke's leadership of the Fed:
As a result, investors are looking at the possibility of increased inflation.
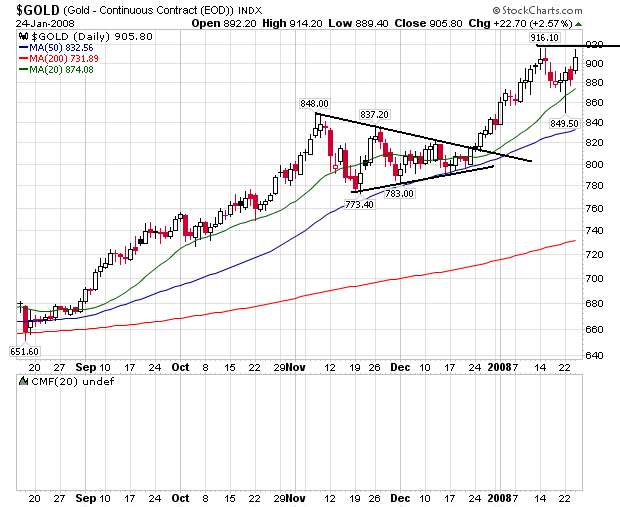
On gold, notice the markets have recently pulled back a touch on a round of profit taking from the recent run up. But yesterday, they printed a large candle and appear ready to move higher if the Fed cuts next week.
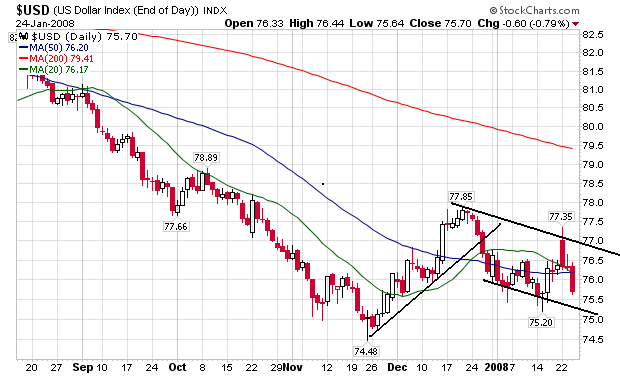
The dollar had a bear market rally from late November to late December, but has since started to move lower in anticipation of further Fed rate cuts. That should be no surprise too anyone.
Fed rate cuts lower borrowing costs throughout the economy and effectively increase the money supply. But cheaper greenbacks can also have a downside: inflation. In particular, natural resources traded globally in dollar terms tend to rise if demand in foreign countries remains solid, making it necessary to purchase the same amount of commodities as before using devalued dollars.
.....
"The market is essentially saying to the Fed, hey, you really want to boost the (U.S.) economy at any cost? Well, here are the costs," said strategist Bill O'Grady, chief global investment strategist the brokerage A.G. Edwards & Sons in St. Louis.
Bernanke is in a terrible spot. He basically gets to either clean-up Greenspan's mess or try an reflate the economy in some measure to prevent pain. The problem is Greenspan's mess is wide and deep and therefore hard to clean-up and there are no more assets to inflate.
What Ben should have done from the beginning is to say the following: "Alan left a big damn mess that is going to take a long time to clean up. There is no getting around the fact that some pain will be felt. However, what we can do is make sure the economy does not completely spin out of control by keeping prices somewhat stable."
The problem with the previous plan is twofold: it's really hard to do and we're in the middle of an election year. So, the interest rate cuts will come fast and deep. This is leading some to question Bernanke's leadership of the Fed:
Federal Reserve Chairman Ben Bernanke faces a perception problem: It looks like he is too ready to respond to a falling stock market.
That criticism was sounded after the Fed moved to cut interest rates Tuesday, in part because of fears that an overseas stock-market plunge would spill over to the U.S. The drumbeat grew more intense yesterday as critics and others confronted the possibility that the global selloff was at least partly a false alarm, reflecting French bank Société Générale SA's unwinding of a trader's unauthorized bad bets, and due less to economic anxiety.
As a result, investors are looking at the possibility of increased inflation.
Thursday, futures on everything from gold to corn to lumber to crude oil traded higher, and the broad-based Dow Jones-AIG Commodity Index climbed 2.3%, or 4.202 points, to end at 185.359.
On gold, notice the markets have recently pulled back a touch on a round of profit taking from the recent run up. But yesterday, they printed a large candle and appear ready to move higher if the Fed cuts next week.
The dollar had a bear market rally from late November to late December, but has since started to move lower in anticipation of further Fed rate cuts. That should be no surprise too anyone.
Thursday, January 24, 2008
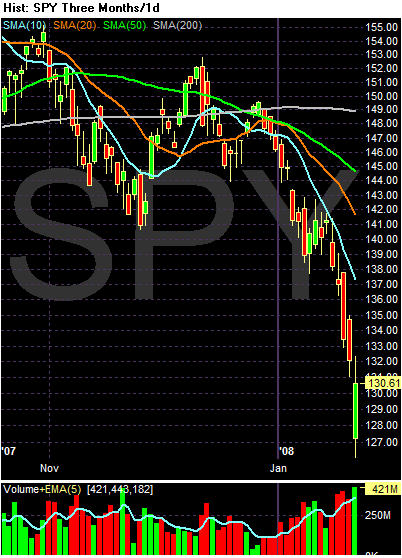
Was It All Just an Illustion?
Ever since I have been writing about the economy (about 4 years) I have focused on the mammoth increase in US debt during this expansion. It has led me to question the underlying vitality of this expansion as a whole.
Let's start with a few basic charts.
Above is a chart from of total household debt. Notice the curve is almost parabolic over the last few years -- and especially this expansion.
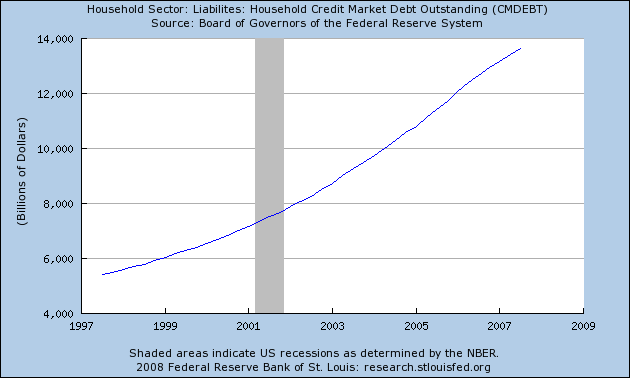
Above is a 10 year chart of household debt. Notice it has increased from about $8 trillion to a little under $14 trillion, which is a really big increase.
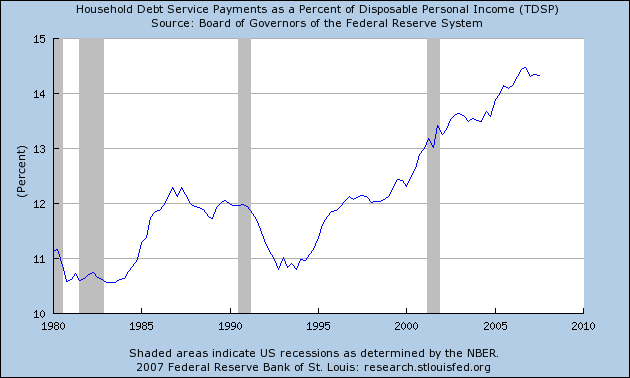
As a result of this increase in total household debt outstanding, the householed debt payment ratio has increased to the highest level in 25 years.
Let's place the household debt level in perspective. Here is a chart tabulated every 5 years of total household debt outstanding and its percentage of GDP and total disposable income. The GDP and disposable income numbers are from the Bureau of Economic Analysis and the household debt numbers are from the Federal Reserve's Flow of Funds Report. The figures for 2007 are for the third quarter.
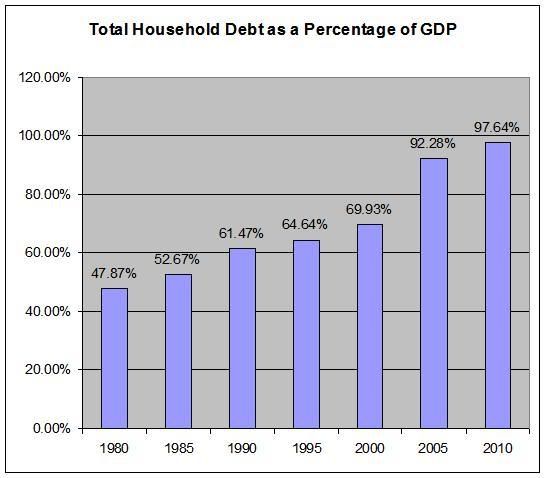
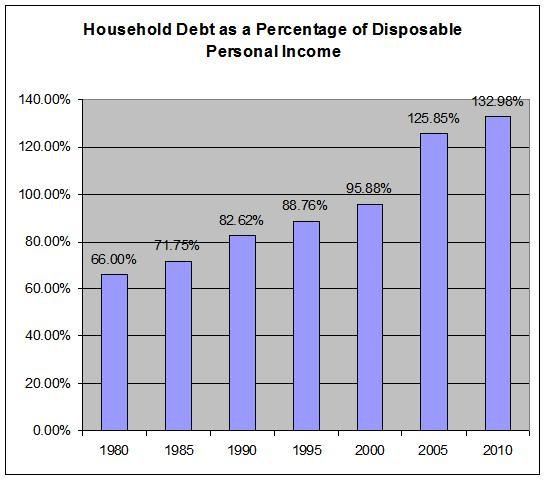
Notice that both percentages jumped sharply during this expansion. This is what easy credit will do for you.
Now -- this massive debt orgy has allowed the US to inflate its home prices.
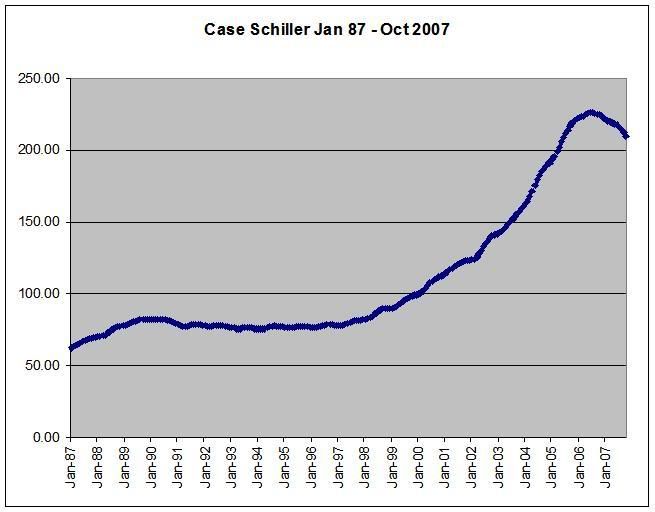
This has allowed Americans to extract home equity loans from their homes to buy more stuff. Because home prices increased so much in value, Americans felt richer, so they felt as though they could spend more.
Now, I'm not alone in questioning this expansion. Business Week has an article titled, How Real Was the Prosperity?" where they ask the same question.
Right now we're just starting to deal with the hangover from this debt orgy. The entire financial sector has been wracked by writedowns for the last 6 months. No one has been spared. Estimates are for total writedowns of $300-$500 billion. So far, we've only had $100 billion or so, so we have a ways to go.
We just had the weakest holiday season of the last 5 years, indicating consumers are starting to get tapped out -- they can literally borrow no more. While it is never a good idea to bet against the American consumer who will sell his mother to buy the next thing, high gas and food prices, a tanking housing and stock market and a weakening job market will undoubtedly provide some serious headwinds for the foreseeable future.
Consumer lending is going through the wringer right now as well -- and for good reason. It use to be that all you needed to get a loan was a pulse. Now you actually have to have a credit score.
But the central problem of this expansion is all of that debt has to go somewhere. You can't just slice and dice a pool of debt into many pieces and completely eliminate risk; that just can't be done. But everyone thought you could do it, which is basically how we got into this mess in the first place. Now everyone has the pleasure of choking on a ton of bad loans. And it's not going to stop anytime soon.
To make matters worse, the level of debt in the economy assumes a certain asset value. For example, if a banker makes a $100,000 loan for a $100,000 house and the home starts to decrease in value, the banker will at some time have to writedown the value of the loan. So as home prices decrease anyone who owns mortgage related debt (and that is literally everyone on the planet) will have to writedown the value of their debt. This constrains their ability to make new loans, which hurts an economy like the US which depends on credit creation.
That's the central point to the Business Week article's title. This expansion is based on the inflation of an asset class -- namely, housing. As that asset increased in value, consumers felt wealthier and therefore spent more. They extracted more equity from their homes for more consumer purchases. This was a net positive for consumer spending and the economy as a whole. However, as that asset value decreases -- which is what we are experiencing now -- the exact opposite is also true. Consumers will spend less because they feel less wealthy. And they probably will for some time.
Let's start with a few basic charts.
Above is a chart from of total household debt. Notice the curve is almost parabolic over the last few years -- and especially this expansion.
Above is a 10 year chart of household debt. Notice it has increased from about $8 trillion to a little under $14 trillion, which is a really big increase.
As a result of this increase in total household debt outstanding, the householed debt payment ratio has increased to the highest level in 25 years.
Let's place the household debt level in perspective. Here is a chart tabulated every 5 years of total household debt outstanding and its percentage of GDP and total disposable income. The GDP and disposable income numbers are from the Bureau of Economic Analysis and the household debt numbers are from the Federal Reserve's Flow of Funds Report. The figures for 2007 are for the third quarter.
Notice that both percentages jumped sharply during this expansion. This is what easy credit will do for you.
Now -- this massive debt orgy has allowed the US to inflate its home prices.
This has allowed Americans to extract home equity loans from their homes to buy more stuff. Because home prices increased so much in value, Americans felt richer, so they felt as though they could spend more.
Now, I'm not alone in questioning this expansion. Business Week has an article titled, How Real Was the Prosperity?" where they ask the same question.
Consumer Spending: The rule for a prudent individual is simple: Don't spend more than you make. For a long time, the U.S. economy obeyed that rule. As far back as the 1960s, personal spending, adjusted for inflation, has basically tracked the overall growth of the economy, as measured by gross domestic product. Sometimes consumers would get ahead of the economy for a few years, and sometimes fall behind, but never for very long.
That pattern changed in the 1990s. As of the third quarter of 2007, the 10-year growth rate for consumption was 3.6%, vs. GDP growth for the same period of 2.9%. This difference represents an enormous gap. If consumer spending had tracked the overall economy over the past decade as it has in the past, Americans today would be spending about $600 billion less a year. The extra spending has amounted to a total of about $3 trillion since 2001.
Consumer Lending. The past 10 years will go down as one of the greatest consumer-lending sprees ever. Adjusted for inflation, consumer debt—including mortgages—rose an average 7.5% per year since 1997, far faster than the 4.2% rate of the previous 10 years. The last time debt rose so fast was the 1960s, as the postwar generation bought homes and autos. If Americans had kept borrowing at their pre-1997 pace, they would have had about $3 trillion less in debt.
Corporate Earnings. Yes, there's been a profit boom in recent years. Corporate earnings, as measured by government statisticians, have averaged 8% of GDP over the past decade, up from a low of 6.5% in the early '90s. That has helped propel stocks upward.
But here's an unfortunate truth—the profit surge has been mainly in one area, financial services. Financial institutions have benefited from the consumer credit boom, the proliferation of new financial instruments, and relatively low rates. By contrast, the earnings of nonfinancial companies over the past decade have averaged about 5.3% of GDP, about the same since the mid-1980s. There are few signs of any acceleration, even after years of restructuring.
Right now we're just starting to deal with the hangover from this debt orgy. The entire financial sector has been wracked by writedowns for the last 6 months. No one has been spared. Estimates are for total writedowns of $300-$500 billion. So far, we've only had $100 billion or so, so we have a ways to go.
We just had the weakest holiday season of the last 5 years, indicating consumers are starting to get tapped out -- they can literally borrow no more. While it is never a good idea to bet against the American consumer who will sell his mother to buy the next thing, high gas and food prices, a tanking housing and stock market and a weakening job market will undoubtedly provide some serious headwinds for the foreseeable future.
Consumer lending is going through the wringer right now as well -- and for good reason. It use to be that all you needed to get a loan was a pulse. Now you actually have to have a credit score.
But the central problem of this expansion is all of that debt has to go somewhere. You can't just slice and dice a pool of debt into many pieces and completely eliminate risk; that just can't be done. But everyone thought you could do it, which is basically how we got into this mess in the first place. Now everyone has the pleasure of choking on a ton of bad loans. And it's not going to stop anytime soon.
To make matters worse, the level of debt in the economy assumes a certain asset value. For example, if a banker makes a $100,000 loan for a $100,000 house and the home starts to decrease in value, the banker will at some time have to writedown the value of the loan. So as home prices decrease anyone who owns mortgage related debt (and that is literally everyone on the planet) will have to writedown the value of their debt. This constrains their ability to make new loans, which hurts an economy like the US which depends on credit creation.
That's the central point to the Business Week article's title. This expansion is based on the inflation of an asset class -- namely, housing. As that asset increased in value, consumers felt wealthier and therefore spent more. They extracted more equity from their homes for more consumer purchases. This was a net positive for consumer spending and the economy as a whole. However, as that asset value decreases -- which is what we are experiencing now -- the exact opposite is also true. Consumers will spend less because they feel less wealthy. And they probably will for some time.
Today's Markets
Today was a consolidation day after yesterday's big rally. If you look at the charts, you'll see a very tight trading range with very little movement.
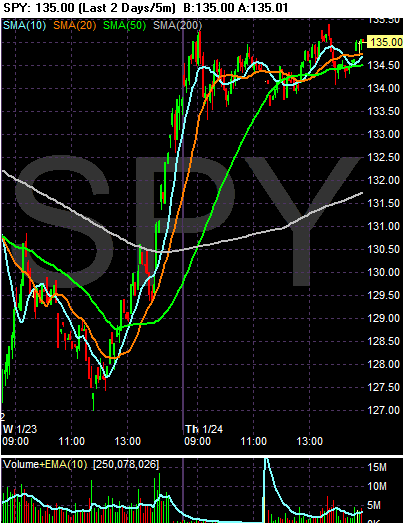
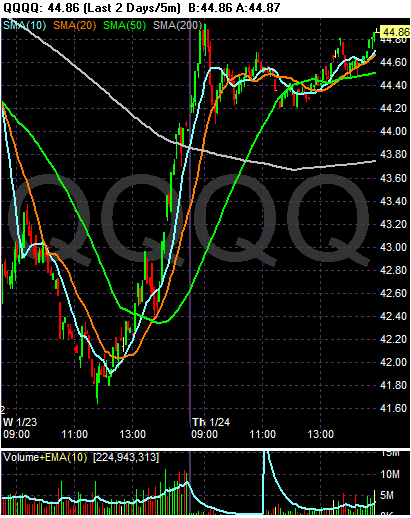
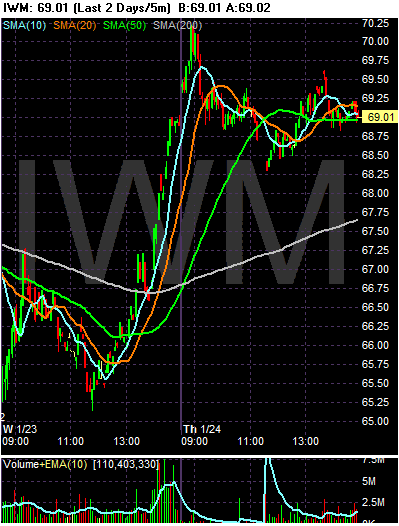
Looking at the daily charts gives further evidence of consolidation. Yesterday the averages printed a large upward moving bar on strong volume. Today we have smaller bars on smaller volume. It is possible that today's action on the IWMs and SPYs formed a spinning top. But I still think we're going to see a more complete move up based on this week's panic slashing from the Fed and the possibility of another 50 BP at their next meeting.
Looking at the daily charts gives further evidence of consolidation. Yesterday the averages printed a large upward moving bar on strong volume. Today we have smaller bars on smaller volume. It is possible that today's action on the IWMs and SPYs formed a spinning top. But I still think we're going to see a more complete move up based on this week's panic slashing from the Fed and the possibility of another 50 BP at their next meeting.
How Bad Will Employment Get?
Let's start with a graph from the St. Loius Federal Reserve. This is a chart of the percentage change in employment from a year ago.
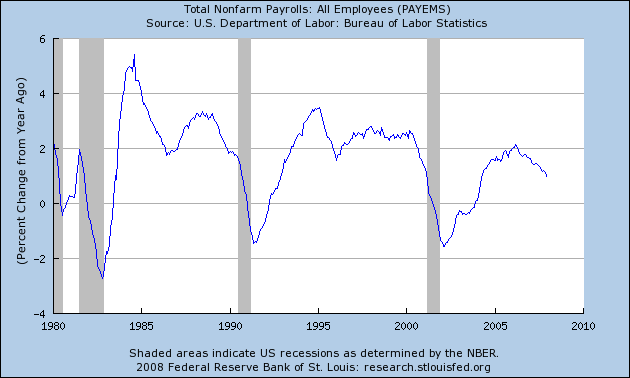
Notice the job growth has been extremely weak, especially compared to the last two expansions. That leads to an important question: assuming an economic slowdown, how bad will employment become?
Rosenberg -- who is a top-notch economist and someone who I have tremendous respect for -- is arguing for a more "traditional" lay-off scenario. From his perspective, he thinks that employers will slash and burn their payrolls to save money.
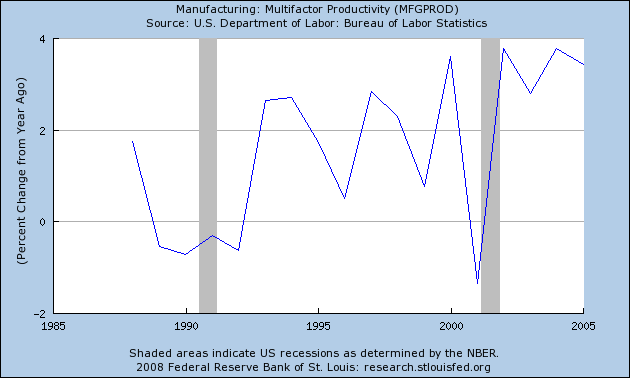
But consider the weakness of the job picture for this expansion. When you look at the chart from the St. Louis Fed, notice employers delayed hiring during this expansion far longer than before. In addition, notice the year-over-year figure topped out at a lower rate than the previous two expansions, indicating that even when the economy was rolling along pretty well, employers were still cautious about hiring. Instead, they made do with less. Here is a chart of the year-over-year change in multifactor productivity from the St. Louis Fed:
Let me throw the following hypothesis out: employers were far more reluctant to hire this expansion. Instead, they hired less but increased their productivity more. As a result, their business models are now wedded to a higher-productivity/lower workers total model. This means businesses can't cut jobs like they would in previous expansions because they would lose valuable employees. In addition, this would negatively impact the increased productivity of their respective businesses, which would have a ripple effect through their respective business.
It's still a hypothesis, but an interesting one.
Notice the job growth has been extremely weak, especially compared to the last two expansions. That leads to an important question: assuming an economic slowdown, how bad will employment become?
"If payrolls are leaner than they usually are when the economy softens, then companies may not have either the need or the scope to lay off workers en masse," said Goldman Sachs economist Ed McKelvey in a recent note.
December's unemployment rate ticked up to 5% from 4.7% in November, but economists disagree on whether it will get worse, and to what degree. David Rosenberg, an economist at Merrill Lynch, said in a note Tuesday that he expects job losses this year to total 2.5 million, similar to cuts in the last recession, and for the jobless rate to hit 5.75% by year end.
Others are more sanguine. "I'm not betting on a string of monthly job losses," said Richard DeKaser, chief economist at National City Corp. in Cleveland. He predicts the jobless rate will rise to 5.25% in the first half of the year and expects the weakest sectors to continue to be manufacturing, construction and financial services.
Rosenberg -- who is a top-notch economist and someone who I have tremendous respect for -- is arguing for a more "traditional" lay-off scenario. From his perspective, he thinks that employers will slash and burn their payrolls to save money.
But consider the weakness of the job picture for this expansion. When you look at the chart from the St. Louis Fed, notice employers delayed hiring during this expansion far longer than before. In addition, notice the year-over-year figure topped out at a lower rate than the previous two expansions, indicating that even when the economy was rolling along pretty well, employers were still cautious about hiring. Instead, they made do with less. Here is a chart of the year-over-year change in multifactor productivity from the St. Louis Fed:
.....While a recession could change their minds, employers are reluctant to institute mass layoffs, which can result in the loss of skilled workers who are costly to replace when the economy improves, said John Silvia, chief economist at Wachovia Bank. Rather, many have put the brakes on hiring new workers in some or all of their operations. "A lot of firms have simply said the risks are too great to add workers," he said.
.....
"If payrolls are leaner than they usually are when the economy softens, then companies may not have either the need or the scope to lay off workers en masse," said Goldman Sachs economist Ed McKelvey in a recent note.
Let me throw the following hypothesis out: employers were far more reluctant to hire this expansion. Instead, they hired less but increased their productivity more. As a result, their business models are now wedded to a higher-productivity/lower workers total model. This means businesses can't cut jobs like they would in previous expansions because they would lose valuable employees. In addition, this would negatively impact the increased productivity of their respective businesses, which would have a ripple effect through their respective business.
It's still a hypothesis, but an interesting one.
I'm Coining a New Fed Term -- "Panic Slashing"
Panic Slashing: When the Federal Reserve realizes its economic models are way off and news events expose its public pronouncements of "everything is alright" as complete bunk, the Fed engages in "panic slashing" -- quickly lowering rates to a negative rate of return after adjusting for inflation in the hopes that someone (anyone) will actually start to make consumer loans and to save the markets from those embarrassing things called "losses".
Was Yesterday a Short-Term Market Bottom?
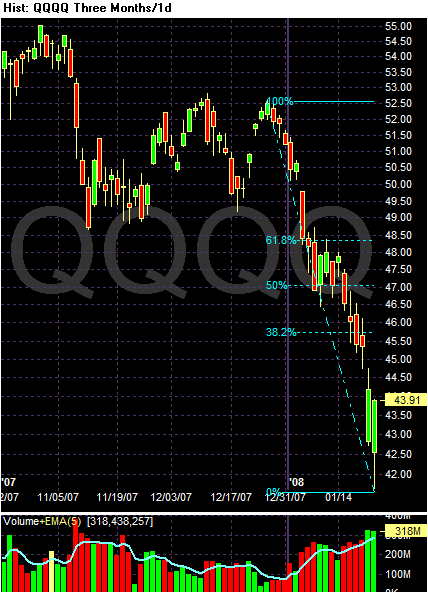
In yesterday's daily wrap-up (which is right below this post) I posted Fibonacci levels based on daily charts of markets. My basic theory there is with the Fed cutting rates (maybe the phrase "panic slashing" is better) and the market in a clear down up down with lower highs and lower lows, this would be a technically appropriate time to see a market reversal.
Let's add some more details to that analysis. From today's WSJ:
Let's look at the daily chart of the indexes.
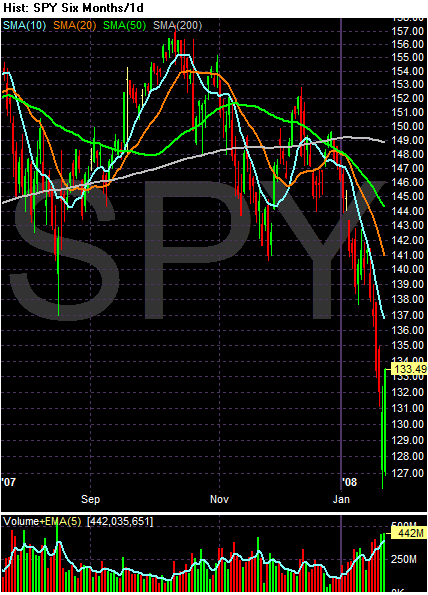
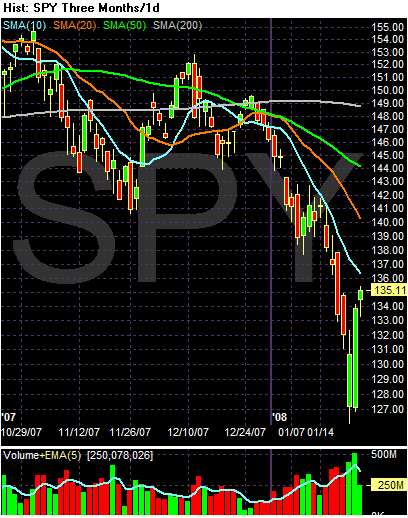
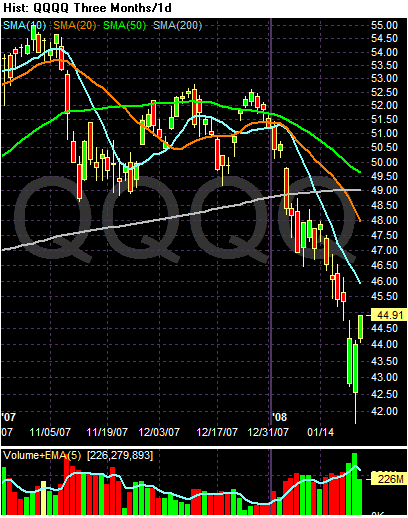
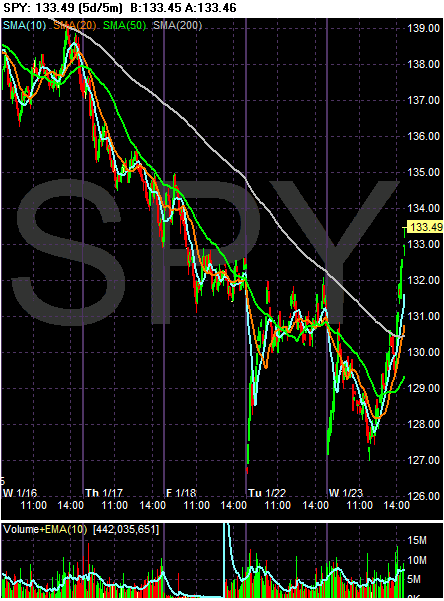
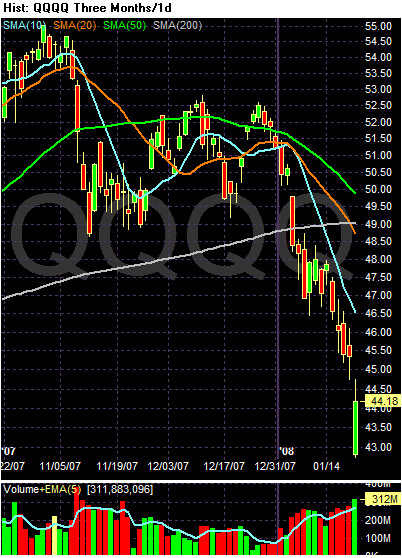
Notice on the SPYs the increasing volume on the sell-off culminating with the huge up bar on really heavy volume yesterday. However, also notice the chart still has a ton of very bearish elements -- the 10, 20 and 50 SMAs are all headed lower, the shorter SMAs are below the longer SMAs and prices are below the SMAs.
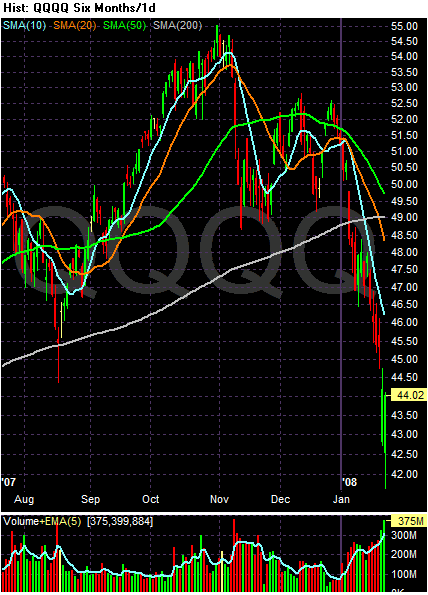
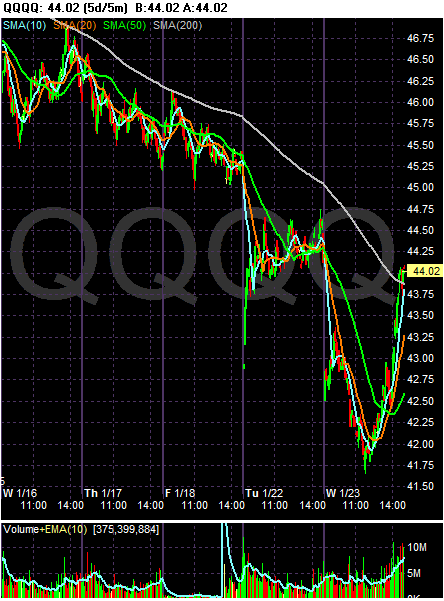
The exact same analysis for the SPYs applies to the QQQQs
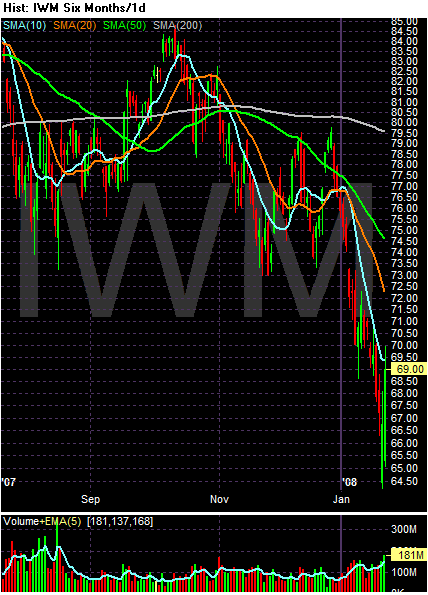
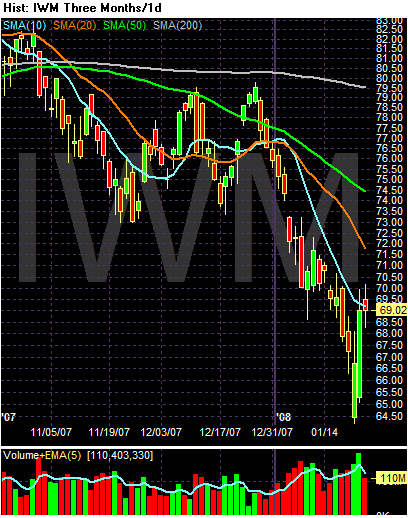
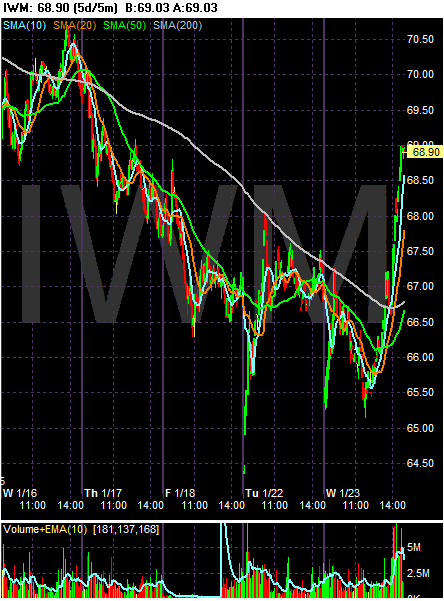
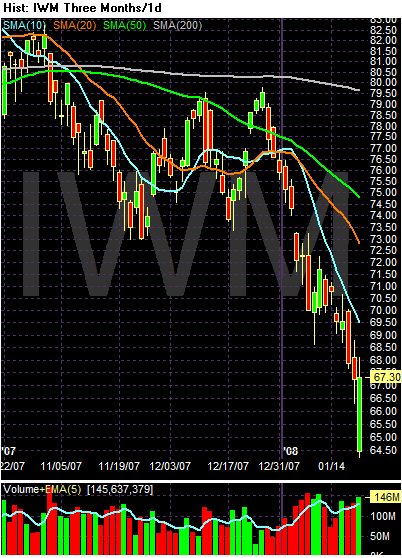
The IWMs have the same analysis, with the caveat that volume totals are less impressive here. While volume has picked-up over the last few weeks, it hasn't been a mammoth increase.
Let's add one more chart to the mix.
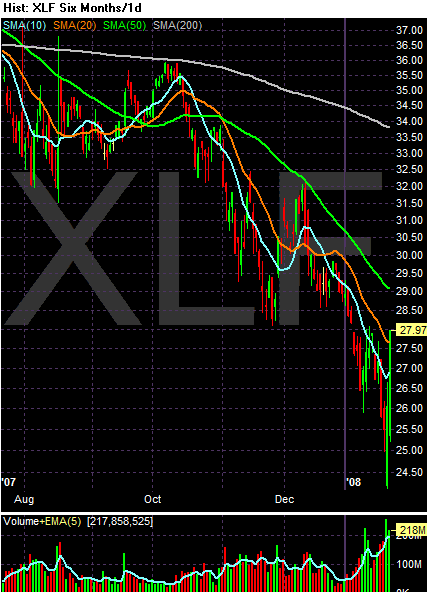
Financials led the market lower starting in early October of last year. Yesterday we saw a huge rally on really heavy volume. Also note that prices moved through the 10 and 20 day SMAs on a really strong bar.
Regarding the problems in the bond insurers, Herb Greenberg had the following letter on his blog from an MBIA critic:
Those are some incredibly damning facts. Actually, just one of those would be a damning fact, but together they illustrate the depths of the problems with the bond insurers and why a bail-out would probably make sense right now.
Personally, I still think the financials are in for an incredibly difficult year. Losses have been large this earnings season and loan loss provisions are increasing because of an increase in defaults. In addition, total losses from the sub-prime mess have been projected to be between $300-$500 billion, yet we have only seen about $100 billion in writedowns. Assuming the $300-$500 figure is accurate, then we're only 1/3 of the way through this mess.
Let's add some more details to that analysis. From today's WSJ:
The Dow's 631.86-point intraday swing was its biggest since July 2002, one of the low points of the last bear market. There have been just nine days with 500-plus point swings since 1995, many of which occurred at major market turning points.
Let's look at the daily chart of the indexes.
Notice on the SPYs the increasing volume on the sell-off culminating with the huge up bar on really heavy volume yesterday. However, also notice the chart still has a ton of very bearish elements -- the 10, 20 and 50 SMAs are all headed lower, the shorter SMAs are below the longer SMAs and prices are below the SMAs.
The exact same analysis for the SPYs applies to the QQQQs
The IWMs have the same analysis, with the caveat that volume totals are less impressive here. While volume has picked-up over the last few weeks, it hasn't been a mammoth increase.
Let's add one more chart to the mix.
Financials led the market lower starting in early October of last year. Yesterday we saw a huge rally on really heavy volume. Also note that prices moved through the 10 and 20 day SMAs on a really strong bar.
The rally was supercharged late in the day by news that insurance regulators met with major Wall Street firms to discuss ways to stabilize and potentially bail out big bond insurers. These insurers have taken a hit because of their exposure to securities tied to subprime mortgages. Their instability threatens the wider financial system because they insure tens of billions of dollars in bonds, many of them held by Wall Street firms.
Regarding the problems in the bond insurers, Herb Greenberg had the following letter on his blog from an MBIA critic:
Does a company deserve your highest Triple A rating whose stock price has declined 90%, has cut its dividend, is scrambling to raise capital, completed a partial financing at 14% interest (now trading at a 20% yield one week later), has incurred losses massively in excess of its promised zero-loss expectations wiping out more than half of book value, with Berkshire Hathaway as a new competitor, having lost access to its only liquidity facility, and having concealed material information from the marketplace? Can this possibly make sense?
Those are some incredibly damning facts. Actually, just one of those would be a damning fact, but together they illustrate the depths of the problems with the bond insurers and why a bail-out would probably make sense right now.
Personally, I still think the financials are in for an incredibly difficult year. Losses have been large this earnings season and loan loss provisions are increasing because of an increase in defaults. In addition, total losses from the sub-prime mess have been projected to be between $300-$500 billion, yet we have only seen about $100 billion in writedowns. Assuming the $300-$500 figure is accurate, then we're only 1/3 of the way through this mess.
Wednesday, January 23, 2008
Today's Markets
Wow -- one heck of a wild ride on the street today. The markets opened lower, but then rallied hard after about 11 CST.
I think this observation makes the most sense in explaining today's rally:
Briefing.com also noted that program trading probably had something to do with the rally:
Below are the chart that show the rally in a 5-day context. Note the extremely heavy volume at the end of the day and the fact that all the indexes closed at or near session highs.
Now -- let's speculate about the upcoming week or so of trading.
Yesterday the Fed lowered by 75 basis points. A 50 basis point cut is widely expected at the next Fed meeting. Let's place these moves in a broader market context.
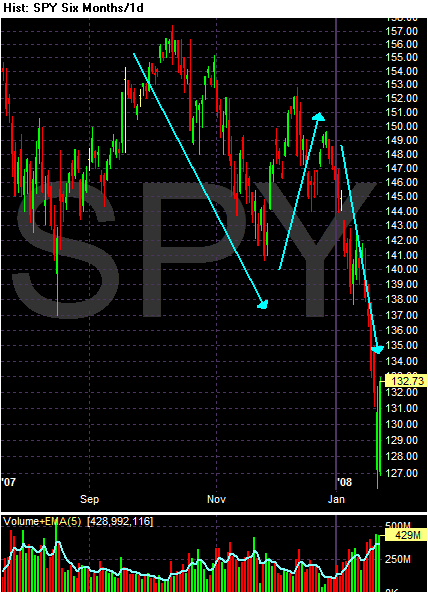
All three averages are clearly in a down, up, down pattern with lower lows and lower highs.
Let's assume that we are now is a reversal of the latest downward sloping leg, which makes sense in the face of aggressive Fed action. Here are the Fibonacci levels for a possible rebound level for each of the indexes:
I want to add, I still think we're in a bear market. The financial sector is still a wreck; Christmas sales were weak and housing is still a mess. None of these problems is going to go away overnight. That means when the thrill of rate cuts is over, traders will once again be confronted with an economic picture that is poor.
I think this observation makes the most sense in explaining today's rally:
"There does come a point and time when the market itself recognizes that it got out of hand, and that is when bargain-hunters can come in," said Peter Cardillo, chief market economist at Avalon Partners.
.....
"You might say this is a belated reaction to what the Fed did this week, compounded by hopes for the Fed to do more next week," Cardillo said. Traders who bet on the Fed's target fed funds rate were pricing in on Wednesday a 100 percent chance of a 0.50 percentage-point cut by the central bank when it meets next week.
Briefing.com also noted that program trading probably had something to do with the rally:
The market has found a new rally gear in the past half hour, greased by program trading activity that has carried the Dow more than 200 points higher in the last 30 minutes. The S&P and Nasdaq have followed suit, and now, all three major indices are on positive ground after being down sharply earlier in the day.
Below are the chart that show the rally in a 5-day context. Note the extremely heavy volume at the end of the day and the fact that all the indexes closed at or near session highs.
Now -- let's speculate about the upcoming week or so of trading.
Yesterday the Fed lowered by 75 basis points. A 50 basis point cut is widely expected at the next Fed meeting. Let's place these moves in a broader market context.
All three averages are clearly in a down, up, down pattern with lower lows and lower highs.
Let's assume that we are now is a reversal of the latest downward sloping leg, which makes sense in the face of aggressive Fed action. Here are the Fibonacci levels for a possible rebound level for each of the indexes:
I want to add, I still think we're in a bear market. The financial sector is still a wreck; Christmas sales were weak and housing is still a mess. None of these problems is going to go away overnight. That means when the thrill of rate cuts is over, traders will once again be confronted with an economic picture that is poor.
Please Visit Some of My Links
Traffic is really up over the last few days, which is understandable given the overall situation.
Over on the right hand side of the web page I have some links to various economic and market blogs. These are blogs I read everyday and I have always found them very informative. I would encourage you to click on a few to see what you think. Right now the best thing anyone can do is to accumulate as much knowledge about what is happening. While it may not make the ride easier, at least you'll understand what is going on.
Over on the right hand side of the web page I have some links to various economic and market blogs. These are blogs I read everyday and I have always found them very informative. I would encourage you to click on a few to see what you think. Right now the best thing anyone can do is to accumulate as much knowledge about what is happening. While it may not make the ride easier, at least you'll understand what is going on.
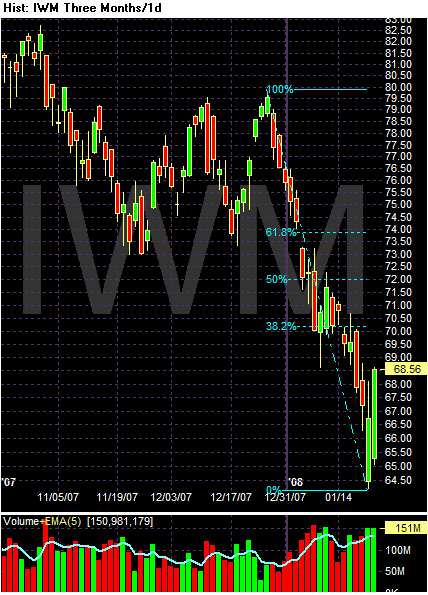
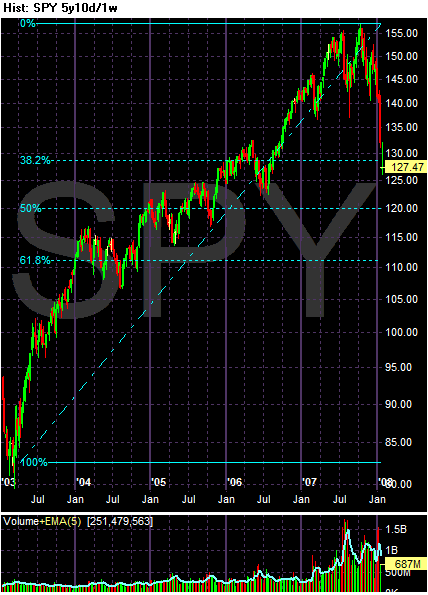
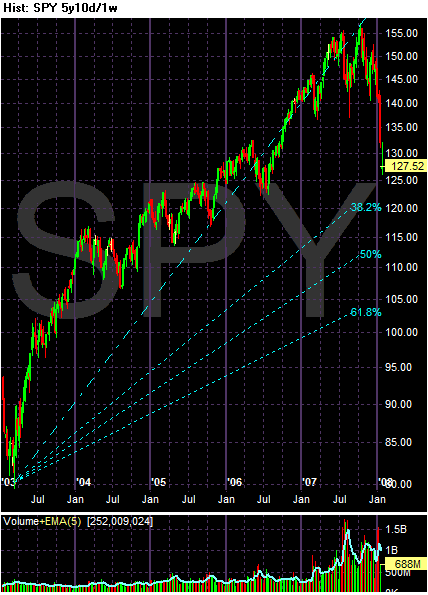
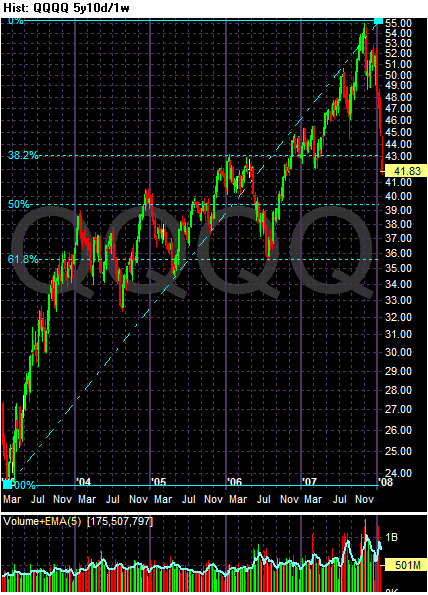
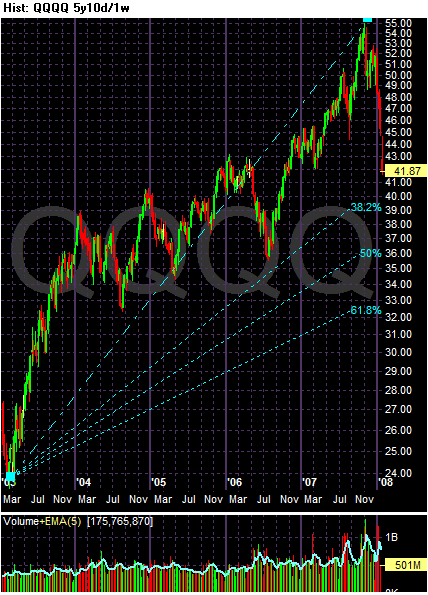
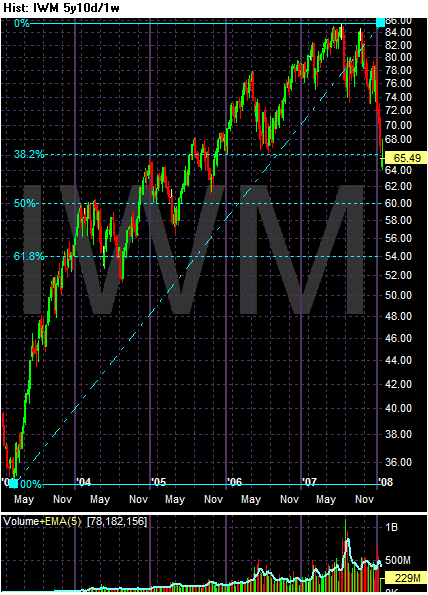
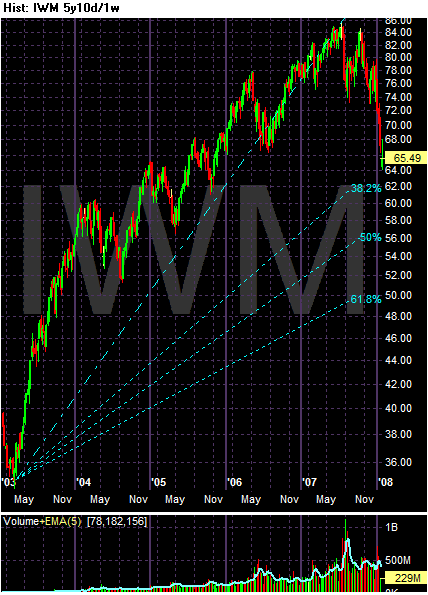
Major Market Fibonacci Levels
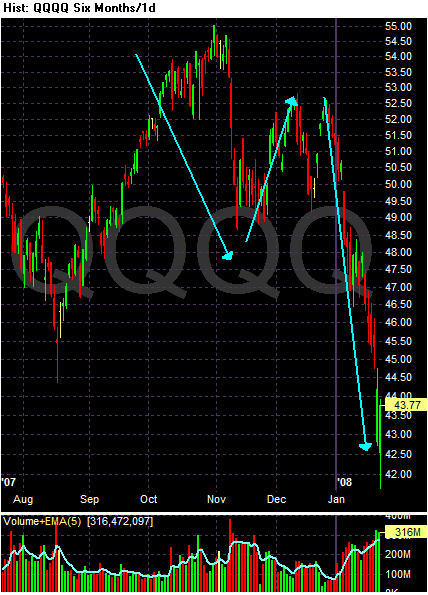
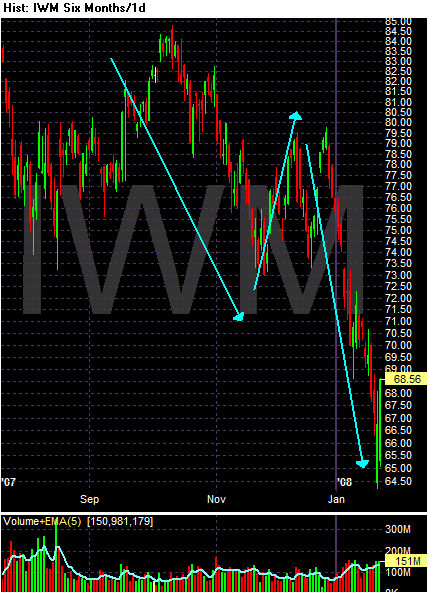
This is a "for what it's worth" post. Below are the 5 year charts of the SPYs, QQQQs and IWM with Fibonacci levels and Fibonacci fan levels. None of these are guaranteed to occur. But these are levels that other people will be looking at in the market, so it's good to know where they are.
Why A Rate Cut Won't Help, pt. V
From the WSJ:
The financial sector is really sick right now. And it's not just one player -- it's everybody in the system. Loan loss reserves are increasing, banks are looking at ways to increase capital, writedowns are hammering earnings.
The underlying hope of a rate cut is it will encourage financial players to make new loans and thereby stimulate the economy. But what banks are looking to repair the damage of previously made poor lending decisions, making new loans is far from their minds.
The glum news from U.S. banks continued with steep declines in fourth-quarter profit at five large lenders, led by Bank of America Corp. and Wachovia Corp., while mortgage-related woes plunged regional bank National City Corp. to a steep loss.
.....
The results capped a miserable earnings season for the banking industry, which was riding high until the mortgage meltdown triggered huge write-downs on investments, forced banks to begin hastily rebuilding loan-loss reserves, and exposed how far many lenders strayed from their roots during the housing boom. "It is back to basics," Bank of America Chief Financial Officer Joe Price told analysts in a conference call yesterday.
.....
Despite saving $500 million a year with the dividend cut, Jeff Kelly, National City's chief financial officer, said the Cleveland bank still is considering "a number of options for nondilutive...capital issuance this quarter."
.....
At Regions Financial Corp., Birmingham, Ala., which has a major presence in Florida and other parts of the Southeast being clobbered by the housing downturn, profit tumbled 80%. KeyCorp, of Cleveland, reported an 83% profit decline. Fifth Third Bancorp of Cincinnati saw its fourth-quarter net income slide 39%. National City swung to a loss of $333 million, or 53 cents a share, from a year-earlier profit of $842 million, or $1.36 a share.
While all six banks said the performance of many businesses remains at least decent overall despite the weakening economy, deteriorating credit quality is causing loan-loss reserves to balloon in anticipation of further trouble. The six banks reported a combined loan-loss provision of $6.22 billion in the fourth quarter, up 181% from $2.21 billion a year earlier.
The financial sector is really sick right now. And it's not just one player -- it's everybody in the system. Loan loss reserves are increasing, banks are looking at ways to increase capital, writedowns are hammering earnings.
The underlying hope of a rate cut is it will encourage financial players to make new loans and thereby stimulate the economy. But what banks are looking to repair the damage of previously made poor lending decisions, making new loans is far from their minds.
Apple Reports Disappointing Projections
From the WSJ:
I usually don't write on a specific company, especially in tech, but this is important. Consider the above story in conjunction with these breadth charts:
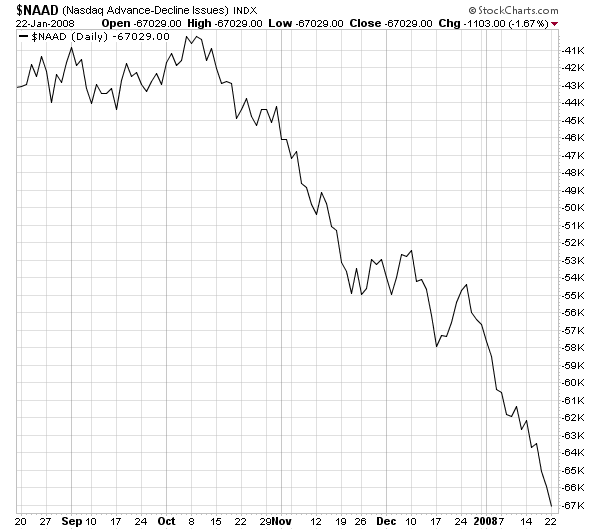
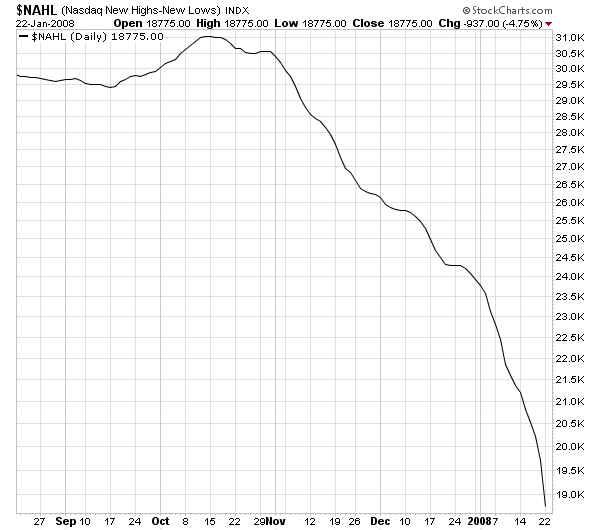
NASDAQ's advance/decline line and new highs new lows line has been decreasing since October. This is a prime reason why I have not bought into the "tech will save us" bandwagon. The bottom line is fewer and fewer issues are advancing and making new highs. As a result, fewer and fewer stocks are responsible for the market's gain.
Apple was one of those stocks responsible for the market increasing. But now it's being conservative with its earnings and it's dropping hard as a result. A final piece of the NASDAQ puzzle is starting to fall.
Attention turns Wednesday to the tech sector, as Apple reported a 58% fiscal first-quarter profit rise, but it steered the market to expect it will earn 94 cents a share in this quarter, well below analyst estimates of $1.09.
"The company is low-balling the Street on the March quarter, but this is not a good environment to lowball the market," said Romeo Dator, who manages U.S. Global Investors All-American Equity Fund. Apple shares dropped nearly 10% in Frankfurt trade.
I usually don't write on a specific company, especially in tech, but this is important. Consider the above story in conjunction with these breadth charts:
NASDAQ's advance/decline line and new highs new lows line has been decreasing since October. This is a prime reason why I have not bought into the "tech will save us" bandwagon. The bottom line is fewer and fewer issues are advancing and making new highs. As a result, fewer and fewer stocks are responsible for the market's gain.
Apple was one of those stocks responsible for the market increasing. But now it's being conservative with its earnings and it's dropping hard as a result. A final piece of the NASDAQ puzzle is starting to fall.
What A Real Fed Chairman Looks Like
From Bloomberg:
This is my kind of central banker.
European Central Bank President Jean- Claude Trichet said he's committed to fighting inflation even after stock markets plunged and the U.S. Federal Reserve cut interest rates to avert a recession.
``Particularly in demanding times of significant market correction and turbulences, it is the responsibility of the central bank to solidly anchor inflation expectations to avoid additional volatility,'' Trichet told the European Parliament in Brussels today.
This is my kind of central banker.
Why A Rate Cut Won't Help, pt. IV
Let's take a look at money supply. I'll be using MZM which is:
Here is a chart from the St. Louis Federal Reserve of the total MZM money supply:
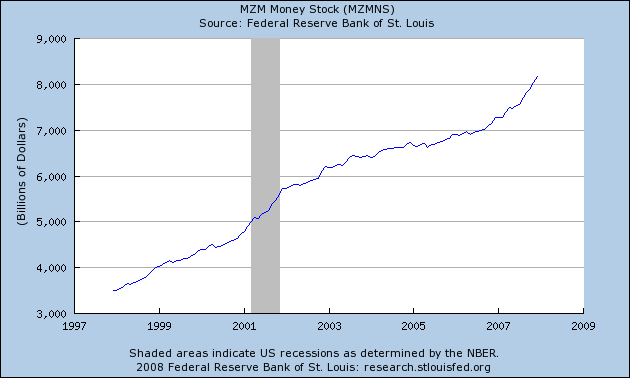
Notice that starting in late 2005 the total started increasing and has been increasing ever since. Let's see what the percentage change chart looks like:
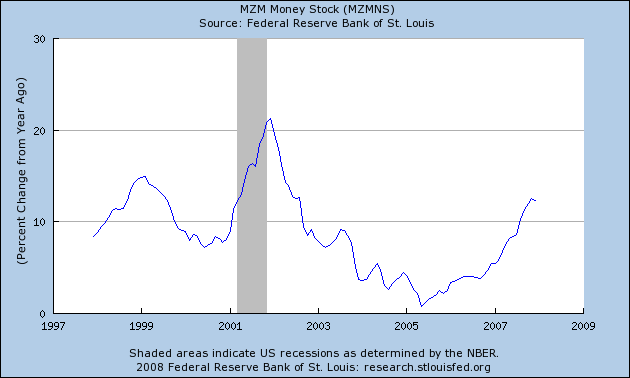
This number has been increasing for the last year and a half, indicating money supply is increasing.
And then there is M3, which the government no longer publishes but which is available from the website shadowstats:
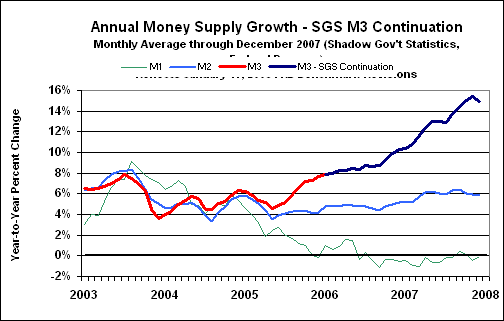
That's a huge increase.
So -- the issue isn't money supply. The facts show there is ample money in the system. The basic problem is no one wants to lend right now.
A measure of the liquid money supply within an economy. MZM represents all money in M2 less the time deposits, plus all money market funds.
Here is a chart from the St. Louis Federal Reserve of the total MZM money supply:
Notice that starting in late 2005 the total started increasing and has been increasing ever since. Let's see what the percentage change chart looks like:
This number has been increasing for the last year and a half, indicating money supply is increasing.
And then there is M3, which the government no longer publishes but which is available from the website shadowstats:
That's a huge increase.
So -- the issue isn't money supply. The facts show there is ample money in the system. The basic problem is no one wants to lend right now.
Tuesday, January 22, 2008
Read This Now
From Herb Greenberg:
Here's the money quote:
I agree completely with his analysis.
Greenberg always has a very fresh perspective on what is going on in the economy -- you should read him whenever he posts something because you are sure to get an angle you hadn't considered.
Here's the money quote:
I wrote here last month that the Fed did the right thing by cutting just a quarter of a percent a few weeks before the holidays. That would give them a chance to see how the consumer was really doing.
They got the answer pretty fast: The consumer is doing horribly. The value of their homes, especially in the most inflated parts of this country, has deflated. The availability of credit via their homes or other sources has deflated. The value of their 401ks and IRAs has deflated.
As a result, their confidence has been crushed, and it’s unclear how many rate cuts it will take to reverse the trend. The trouble, away from Wall Street, is really quite simple: America has been living out of its means, fueled by a Fed that made credit so cheap that it appeared, at one point, you were getting paid to take the cash. With today’s cut, the Fed Funds rate will fall to 3.50%; last time it was that low was August 9, 2005, when the market was lower than it is today. By contrast, it sank to 1% on June 25, 2003. Mortgage rates, meanwhile, for 30-year loans are averaging around 5.5%, still well above their boom levels; ditto for the prime rate.
I agree completely with his analysis.
Greenberg always has a very fresh perspective on what is going on in the economy -- you should read him whenever he posts something because you are sure to get an angle you hadn't considered.
Today's Markets
First, read this post from Afraid to Trade. He notes that today we had one of the most amazing gap fills he has ever seen -- a sentiment I agree with.
A look at the daily charts shows the Fed's rate cut worked. Although the markets opened lower ona bug gap down, all the averages spent the rest of the day rallying to fill the gap, slowly working their way back to unchanged (except in the case of the QQQQs).
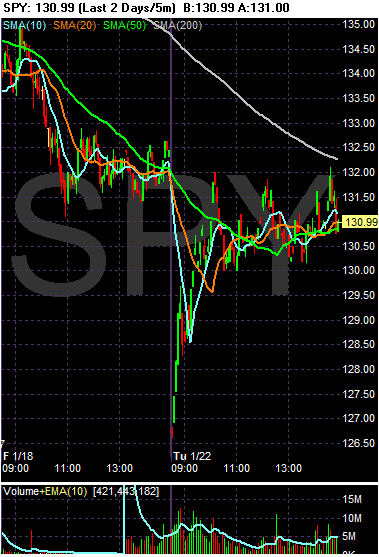
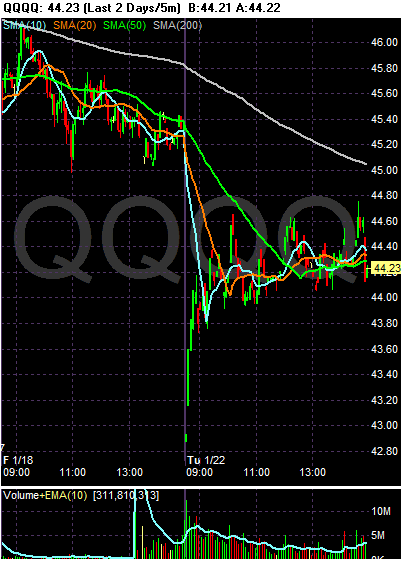
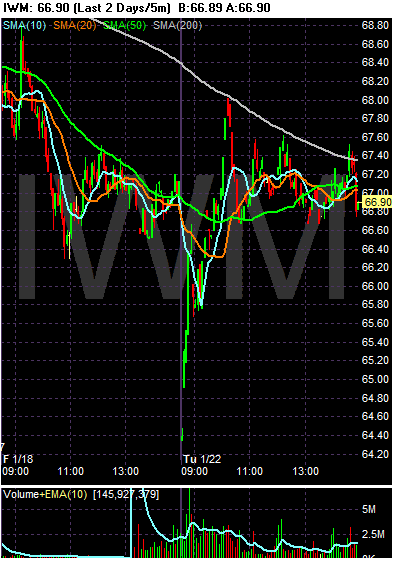
Let's take a look at the daily charts. These show the possibility that what we had today was a selling climax -- a day of heavy selling at the end of longish downturn. Only time will tell if that analysis is correct.
A look at the daily charts shows the Fed's rate cut worked. Although the markets opened lower ona bug gap down, all the averages spent the rest of the day rallying to fill the gap, slowly working their way back to unchanged (except in the case of the QQQQs).
Let's take a look at the daily charts. These show the possibility that what we had today was a selling climax -- a day of heavy selling at the end of longish downturn. Only time will tell if that analysis is correct.
Why A Rate Cut Won't Help, pt. III
Below I mentioned that many financial firms are writing down debt. Today we have several announcement on those matters.
From the WSJ:
From Street.com
With losses and increases in loan-loss provisions of that size financial companies will not be making a lot of new loans regardless of what the prevailing interest rate is.
From the WSJ:
Wachovia Corp.'s fourth-quarter net income plummeted 98%, as the company's deteriorating lending portfolio forced it to dramatically increase its loan-loss provision. The company also saw its bad loans and delinquencies surge.
.....
The company increased its loan-loss provision to $1.5 billion from $206 million. Wachovia, the fourth-largest U.S. bank by consolidated assets, last month raised its loan-loss provision estimate to $1 billion over charge-offs and estimated pretax market-related losses close to $1.34 billion.
From Street.com
Bank of America (BAC - Cramer's Take - Stockpickr - Rating) on Tuesday reported its fourth-quarter profit plunged 95%, hurt by the ongoing credit crunch and a worsening housing environment that forced the company to set aside extra money to cover loan losses.
.....
BofA also incurred $400 million in losses as a result of writedowns to securities purchased from "certain company-managed cash management funds," as well as weaker trading results. Last month, BofA's asset management unit, Columbia Management, was forced to shut down one of its money market funds after several large institutional investors took their money out amid losses on certain asset-backed securities.
With losses and increases in loan-loss provisions of that size financial companies will not be making a lot of new loans regardless of what the prevailing interest rate is.
Why A Rate Cut Won't Help, pt. II
Let's look at what got us into this mess.
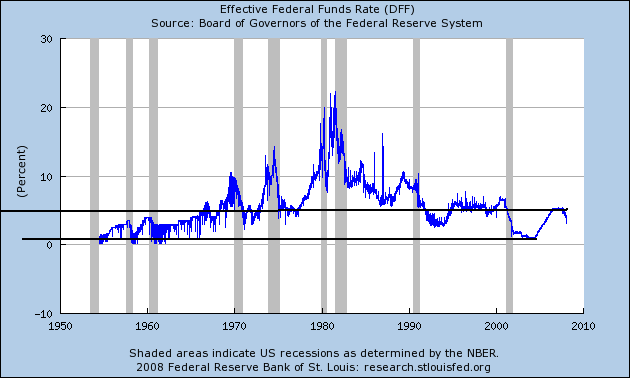
Look specifically at the rates from the early 2000s. I drew a line from those levels all the way back to the beginning of the chart. Notice that rates were not that low for about 40 years.
Let's look at what else happened during that time. Here is a chart of total household debt outstanding:
And here is a chart of the last 10 years of total household outstanding:
Notice the mammoth increase? Total household debt outstanding went form about $8 trillion to a little under $14 trillion, or an increase of about 75%.
All of that debt has to go somewhere -- it doesn't exist in a financial netherworld. It has to become an asset to somebody. And it has -- in the form of a massive amount of securitizations which are currently being written down by literally every financial name in the business. So far we've seen about $100 billion or writedowns in the financial markets and we are going to see more. That's the central problem right now; it's not interest rates but the amount of crap on the books of various financial players (hell -- all the financial players).
In other words, the problem isn't the need too underwrite more consumer debt -- we are already choking on consumer debt. The problem is the system made too many loans that are now going bad. And the only way to wean us off of that problem (easy money) is to feel the pain so we don't do it again.
Subscribe to:
Posts (Atom)