Saturday, July 24, 2021

Weekly Indicators for July 19 - 23 at Seeking Alpha


 - by New Deal democrat

My Weekly Indicators post is up at Seeking Alpha.

No visible impact on the economy yet due to the Delta wave. In March 2020, the first indicator to tip over was restaurant reservations. I would expect that to be the first item to suffer now as well.

As usual, clicking over and reading will not only bring you up to the virtual moment, but bring me a penny or two for my efforts.

Friday, July 23, 2021

Comments on existing home sale prices


 - by New Deal democrat

Existing home sales were reported yesterday. Since, although they are about 90% of the market, they have much less effect on the economy than new home sales, I normally don’t pay that much attention.


But I did want to emerge from my vacation hideaway to make a few comments.

1. Inventory is up 11% YoY. Inventory follows prices, and as prices rise, more and more people decide now is a good time to sell their house (especially if they are downsizing). A huge number of people held off selling during the pandemic lockdowns last year in spring. Those houses are going to come back on the market, and I expect inventory to surge as the pandemic recedes.

2. Prices are up 23.4% YoY, almost as insane an increase as last month’s 23.6%.

3. Prices are even more extreme compared with income as they were at the height of the housing bubble. Using average hourly income, here’s how many hours a person would have to work to buy the median existing home for sale last month vs. the two peaks of the bubble, August 2006 and May 2007:

6/21: 14,147 hours
8/06: 12,889
5/07: 12,585

4. But when we look at monthly mortgage payments as a multiple of average hourly income, prices aren’t nearly as extreme as they were at the peak of the bubble, because mortgage rates in June averaged 2.98%, vs. 6.52% in August 2006 and 6.26% in May 2007:

6/21: 59.5 hours
8/06: 81.6 
5/07: 77.6

So, as insane as existing home prices appear now, they could still rise substantially higher. Nevertheless, as they continue to rise, I expect sales to continue to decline (unless mortgage rates come down significantly more).

Thursday, July 22, 2021

New jobless claims rise sharply; is the Delta wave beginning to take its economic toll?


 - by New Deal democrat

New jobless claims are the most important weekly economic datapoint with regard to the effects of vaccination progress. At this point, it is also a test of how much the “delta wave” of new cases is setting economic progress back. Three weeks I wrote that, because progress in vaccinations had largely stalled, “that implies at least a stall in the decline in new claims, and - I actually suspect - an increase, perhaps to about 450,000 per week or so.”

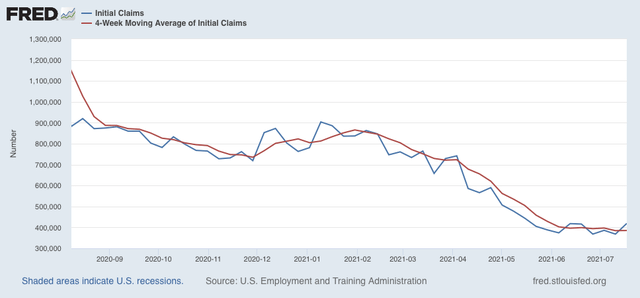
This week’s number may just be noise, or may be evidence such an increase. New jobless claims rose by 51,000 to 419,000, the highest number in 9 weeks. The 4 week average of claims also rose - slightly - by 750 to 385,2500. Here is the trend since last August:


After trending down by roughly 100,000 per month from late February into May, as vaccinations increased quickly, the rate slowed sharply ever since, to a decline of less than 20,000 in the past 6 weeks in the 4 week average.

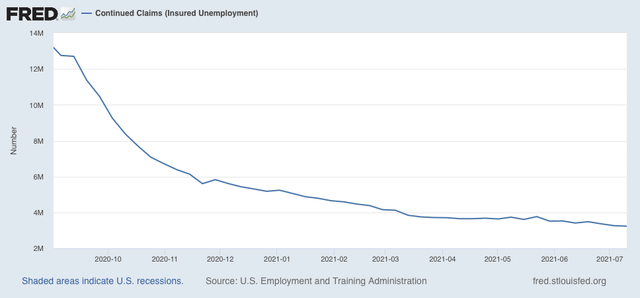
On the other hand, continuing claims, which are reported with a one week lag, and lag the trend of initial claims typically by a few weeks to several months, have declined gradually about 15% from roughly 3,800,000 over the past 4 months, did set another new pandemic low today at 3,236,000:


Some of this decline *may* be due to many States’ termination of all extended jobless benefits due to the pandemic.

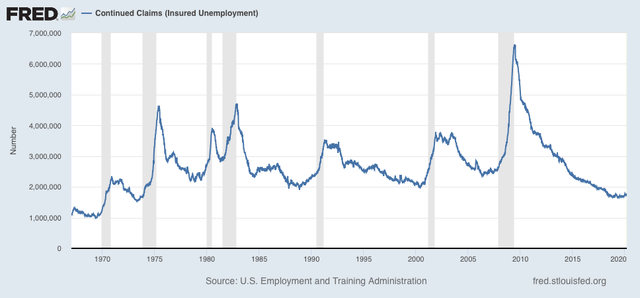
A long term perspective shows that this week’s level is similar to early during other recoveries from most previous recessions, versus at 2,000,000 or below later in strong expansions:


My ultimate target for economic success from vaccinations has been for claims to average 325,000 or below. But with the Delta variant surging, and new COVID cases rapidly increasing to near last summer’s highs, I suspect that both employers and potential customers will become more cautious again. I remain skeptical that there will be a full return to employment until the disease has run its course.


Wednesday, July 21, 2021

Coronavirus dashboard for July 21: brace yourself for the surge in deaths


 - by New Deal democrat

I have been warning since late June that the situation would likely look very different by the end of July. By 2 weeks ago, I wrote:

In the near future, there appears to be bad news and *relatively* “good” news for the US. The bad news is that the “delta wave” is spreading, and we should expect a real outbreak on the order of last summer’s by early August. The *relatively* “good” news is that the death rate is likely not to be nearly so bad, if the experience in the UK is any guide.”


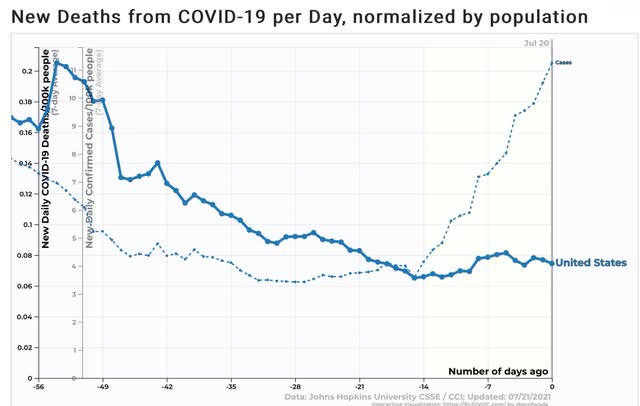
Cases have nearly tripled in the US in the past 2 weeks:

Since deaths lag by about 28 days, we haven’t nearly begun to see the kind of increase that is already baked into the cake.

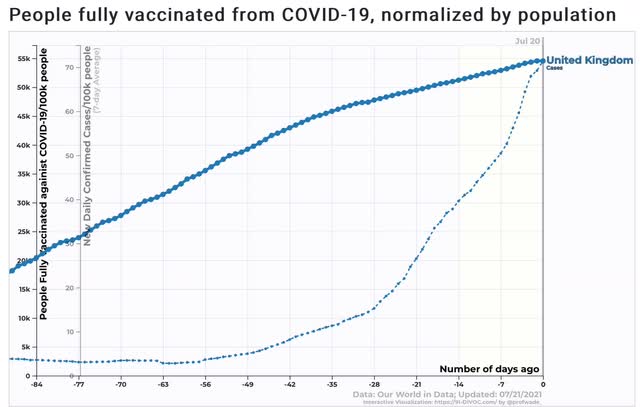
In the UK, the government has been congratulating itself over the low death rate. And in comparison with the number of deaths last winter, they are correct. To some extent, this is due to the fact that 15% more of the UK population has been vaccinated during the Delta wave there:


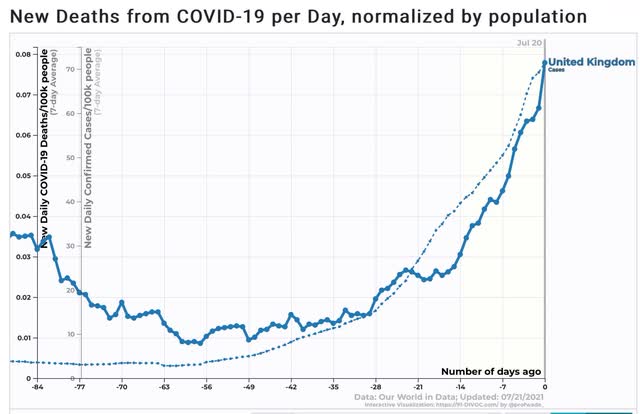
But over the last 2 weeks, the death rate in the UK has actually increased *faster* than the rate of new cases:


If we compare the increase in deaths in the UK over the past two weeks with the increase in cases 2 to 4 weeks before, it isn’t clear at all that the death rate there isn’t going to follow cases proportionately higher over the next month.

Turning to the US, deaths have only risen slightly so far, but again, since deaths follow cases by about 4 weeks, we are probably only 2 weeks away from a proportionate increase in cases. And in the US, there has been no comparable surge in vaccinations since the onset of the Delta wave. In fact, there has been a subsidence.

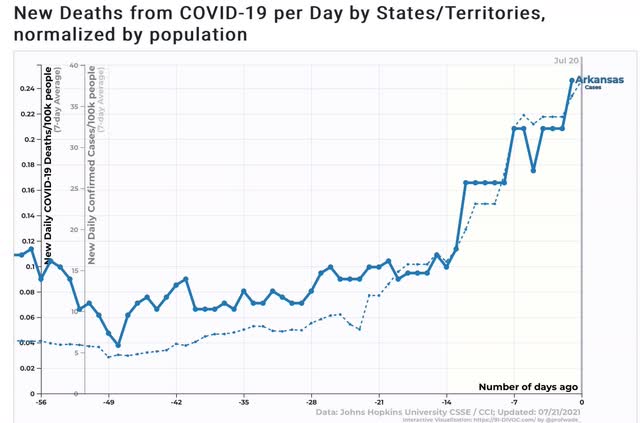
For a taste of what is in store, here are new cases and deaths in Arkansas, one of the States where the Delta wave increase started the earliest:


Deaths have risen just as fast as cases, and started to rise very quickly after cases did.

So, brace yourselves. Cases have nearly tripled in the US over the past 2 weeks. Deaths are likely to increase to nearly 1000/day over the next 2 to 4 weeks.

One more thing: as I wrote a few days ago, the virus is essentially a parasitic copy machine. Its adaptive mechanism is chance mutation. But the human *reaction* to the virus, and to knowledge about the trend in cases and deaths, is fiendishly difficult to model. For example, almost certainly after hearing from their lawyers, Fox News issued a spate of “get the vaccine!” messages from their hosts. Will that continue, or even intensify? Will Congressional GOPers and Red State governors change their tunes? As cases and even more importantly deaths go parabolic, panic is likely to set in. What will the unvaccinated do then? Impossible to know.

Tuesday, July 20, 2021

Housing permits continue decline in June; more challenging YoY comparisons ahead


 - by New Deal democrat

First, a brief comment about the NBER’s declaration yesterday that the COVID recession ended in April 2020. I am not surprised at all that they chose that date. It has been clear for a year that the trough in economic activity across the board was that month (which we’ll see below as to housing, for example).  Remember that a recovery starts when economic activity improves, even if that improvement is from totally awful to almost totally awful. The only thing that surprised me about the NBER announcement was that I expected them to wait for next week’s GDP report, which will probably show that Q2 set a new all time peak, surpassing Q1 2020 just before the pandemic.

Now, to housing ...

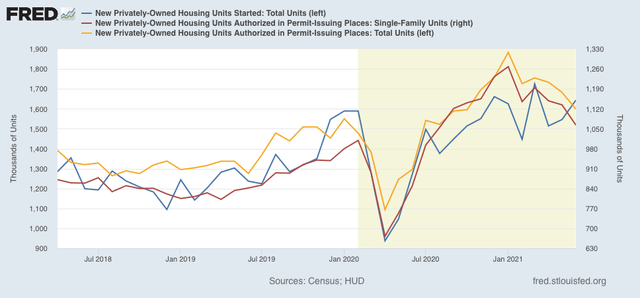
Housing permits, both in total (gold in the graph below) and the less volatile single family permits (red), both continued to decline in June, to the lowest level since last August. The more volatile and slightly lagging measure of housing starts (blue) increased, although they remained below their recent peak from this March and also last December:


Both as to permits and starts, the level of construction activity remains higher than its pre-pandemic peak. At the same time, the decline of slightly more than 15% in permits is consistent with a slowing down of economic growth next year.

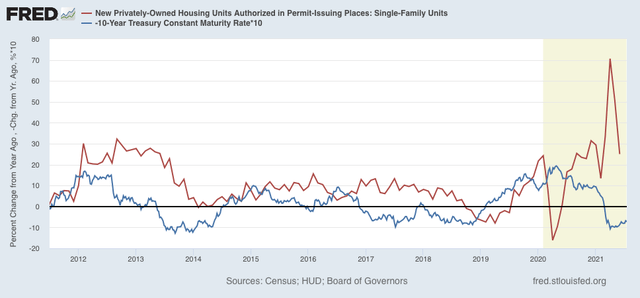
Finally, here is the YoY change in mortgage rates (red)(*10 for scale), inverted so that up = economic positive, and down = economic negative, compared with total permits (blue):


As I have said many times before, mortgage rates lead permits and starts. The big pandemic decline evaporated last July, so beginning next month, the YoY comparisons are going to be much more challenging. On the other hand, the renewed decline in mortgage rates in the past few weeks will at least temporarily put a floor under the decline in housing purchases.

Monday, July 19, 2021

Coronavirus dashboard for July 19: The UK as Delta wave trailblazer for the US


 - by New Deal democrat

An initial note: I am on vacation this week, so posting is likely to be sporadic. I’ll still hit the important data.


Now that the Delta wave is well and truly here in the US, let’s compare it with the UK experience, which has been about 7 weeks ahead, to get an idea where we are going.

Here is the long term view: 
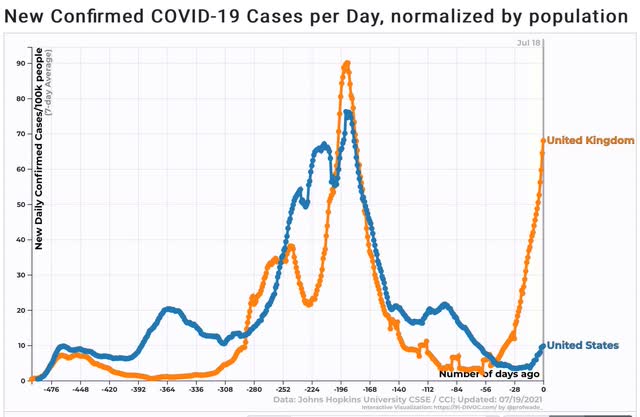

As I said, the UK resurgence due to Delta started about 7 weeks before that in the US.

So the experience in the UK is likely to give us a good idea where the US will be in about 7 weeks. 

So here is a look at cases (narrow line) and deaths (wide line) in the UK:
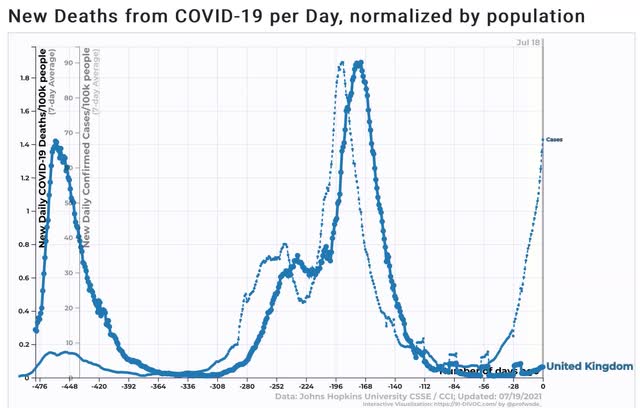

In the autumn and winter wave last year, as well as the Delta wave this year, deaths followed cases with about a 4 week lag.

As similar 4 week lag between cases and deaths shows up in the long term view of the US data:
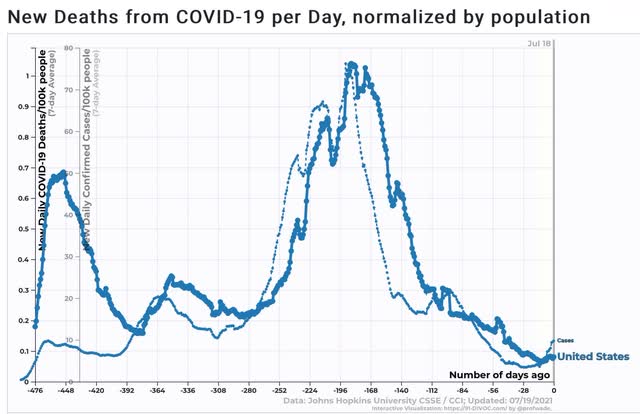

Now let’s take a close-up look at cases in the US (blue) and the UK (orange) over the last 8 weeks:
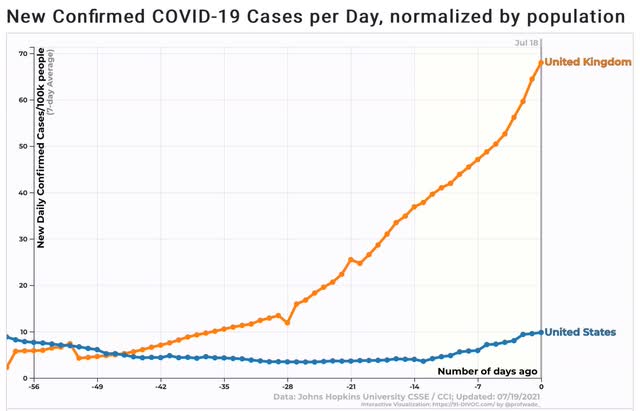

Cases in the UK have doubled roughly every 2 weeks, from a low of about 1900 to over 45,000 now. In other words, cases now are over 20 times higher than they were 8 weeks ago. Cases in the US bottomed about 3.5 weeks ago at 11,300, and have since risen to over 32,000, roughly a tripling during that time.

So if we project US cases to double every 2 weeks over the next 8 weeks, as they have in the UK, that puts us at 512,000 cases daily in the US by mid-September (more than double the US’s peak last winter).

Now let’s look at deaths:
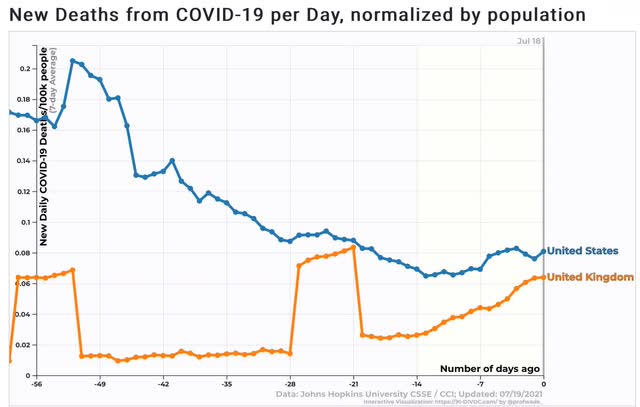

In the UK, deaths bottomed at 8 per day about 6 weeks ago. As of now they have risen to an average of 42 daily, an increase of over 5x. In the last 2 weeks, they have more than doubled. In the US, deaths bottomed at about 215 per day less than 2 weeks ago, and have risen to about 270, a slow increase that is similar to that of the UK in the first several weeks after their bottom in deaths.

If the US follows the same course as the UK, 1 month from now the US will have about 1000 deaths per day. 

But remember, deaths follow cases with a 4 week lag. So if the US has 16x more cases in mid-September, then by mid-October there will be over 4000 deaths per day.

The question in the US is whether there will be government interventions at the State level to slow down the spread of these new cases, such as reinstating masking and distancing restrictions, and shutting down certain businesses. Unsurprisingly, that is unlikely to happen in the Red States. The other alternative is that individuals reinstate some precautions, such as masking indoors, that they may have recently abandoned. At some point I believe that *will* happen, even in the Red States (as it did last winter), but I do not know how severe conditions must be first.

What I can say is that, if cases and deaths double every 2 weeks, then in about 4 months the Delta variant will have ripped through virtually the entire unvaccinated US population, with deaths following suit about a month later.