Saturday, September 18, 2021

Weekly Indicators for September 13 - 17 at Seeking Alpha


 - by New Deal democrat

My Weekly Indicators post is up at Seeking Alpha.

Despite the fact that Delta has been almost as bad as last winter’s wave of infections, which was the worst to date, and has been almost as bad in terms of deaths as the first wave that hit the NYC area hard, it has had almost no effect on the economy, and in particular consumer behavior.

In the longer term, relatively low unemployment and higher inflation may spur the Fed to raise rates sooner rather than later, but this has not dragged down the long leading indicators too much at this point.

As usual, clicking over and reading should bring you nearly up to the moment as to the economic situation, and bring me some lunch money.

Friday, September 17, 2021

August retail sales rebound slightly, argue for continued strong jobs growth in autumn


 - by New Deal democrat

Let’s take a look at retail sales, which are perhaps my favorite monthly economic indicator, since they tell us so much about average consumer behavior, and are also a good short leading indicator for jobs.

Nominally retail sales increased 0.7% for August, after a -0.6% downward revision to -1.7% for July.  Since consumer prices rose 0.3% in August, real retail sales increased 0.4%. Although real retail sales are down -3.8% from their April peak, they are 11.5% higher than they were just before the pandemic hit:


While the recent decline from April is consistent with a slowing economy ahead, if sales stabilize here I don’t see this as a harbinger of an actual downturn.

As I have written many times over the past 10+ years, real retail sales YoY/2 has a good record of leading jobs YoY with a lead time of about 3 to 6 months. That’s because demand for goods and services leads for the need to hire employees to fill that demand.  The exceptions have been right after the 2001 and 2008 recessions, when it took jobs longer to catch up, as shown in the graph below, which takes us up to February 2020:


Now here is the same graph since just before the onset of the pandemic. Note the scale is much larger, given the huge changes wrought by the early lockdowns, and of course the comparative spikes from the data one year later:


As with the recoveries immediately after the two prior recessions, up until the past several months YoY job creation has been well below YoY real retail sales growth. But for the last 3 months, jobs have caught up to forecast trend.

This argues that we can expect jobs reports in the next few months to average out about even with those from one year ago, which averaged about 500,000 per month.

Thursday, September 16, 2021

Jobless claims continue in normal mid-cycle range


 - by New Deal democrat

Last week I encouraged readers to take the very low jobless claims number with a grain of salt due to Labor Day artifacts, and see if the big reduction was maintained or reversed this week. This week did indeed reverse the pattern somewhat, but not enough to interfere with the overall declining trend.

Initial claims rose 20,000 to 332,000, while the 4 week average declined 4,250 to 335,750, the latter yet another pandemic low:


Continuing claims declined 187,000 to 2,665,000, also another pandemic low (which, to reiterate, may have much to do with the expiration of emergency pandemic benefits in many States):


Here are both the 4 week average of initial claims and continuing claims from 1983 through the end of 2019 (both normed to zero as of this week’s numbers) for comparison:


As is easily seen, both numbers are in typical mid-expansion ranges. 

It remains surprising how little impact the Delta wave has had on this “firing” side of the jobs equation.

If the 4 week average of new claims drops below 325,000 - I.e., if the numbers drop into completely normal strong expansion territory - I  may discontinue weekly pandemic coverage of this metric. 

Wednesday, September 15, 2021

Industrial production now exceeds pre-pandemic level


 - by New Deal democrat

Industrial production, the King of Coincident Indicators, was reported this morning for August, and was positive in a particularly significant way.


Total production increased 0.4% in August, and the manufacturing component increased 0.1%. Nothing particularly special about that; in fact the manufacturing component was a little weak compared with most recent months. Additionally, the July numbers were revised slightly (not significantly) higher and lower for each, respectively.

But what is important, as shown in the graph below in which the respective values are normed to 100 as of February 2020, is that both total and manufacturing production have now exceeded their pre-pandemic levels:


Total production is 0.3% above its February 2020 love, and manufacturing is 1.5% above its prepandemic level.
 
This leaves employment as the only coincident indicator which has not completely  recovered its pandemic deficit.

Tuesday, September 14, 2021

A more “normal” consumer inflation reading for August belies damage to the economy going forward


 - by New Deal democrat

Inflation, along with the expiration of the emergency pandemic payment, is one of the two big threats to this expansion. This morning August consumer inflation was the lowest in 6 months, up only 0.3% - within the range of a normal reading in normal times. Since wages increased 0.5% in August, this means that real wages increased. Let’s take a closer look.

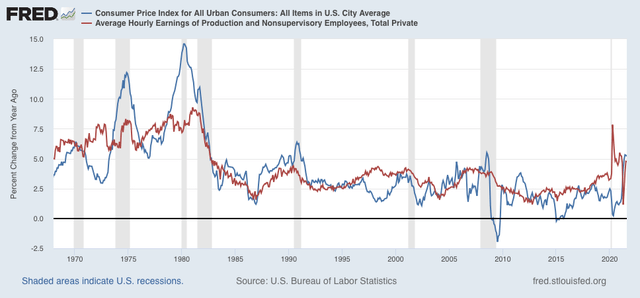
YoY inflation is now 5.2% (blue in the graph below), but typically inflation has not been a concern unless inflation ex-gas (red) has been in excess of 3.0%. After peaking two months ago at 4.1%, it is now 3.9%:

The spike in inflation has gone on long enough at this point that I expect it to inflict some actual damage on the economy.

Housing (shelter) is over 1/3 of the entire index, and reflects households’ biggest monthly expense. The good news is that on a monthly basis both inflation in shelter (blue in the graph below) and rent increases (red) were within their normal ranges in August:

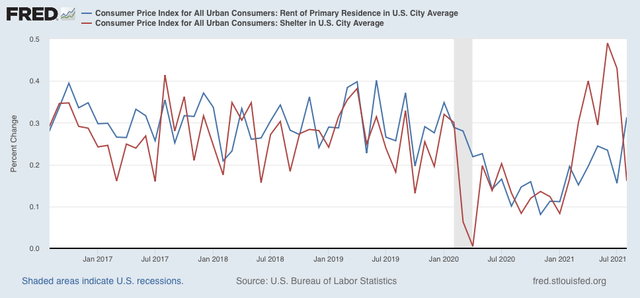
With the expiration of the eviction moratorium due to COVID, most observers are expecting a rapid increase in rents, which will bleed over into the general shelter index (note that the situation would be much different if price increases in housing as measured by the FHFA or Case-Shiller Indexes were employed).

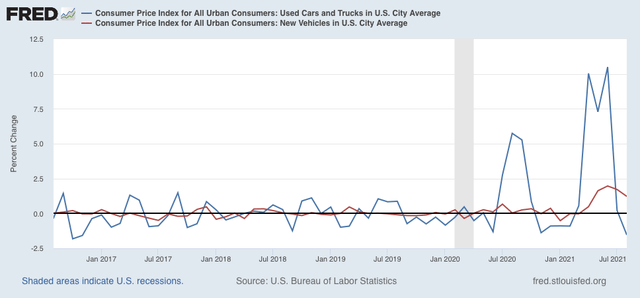
Further, the increase in new car prices decelerated this month, and used car prices finally hit a wall and actually decreased in August:

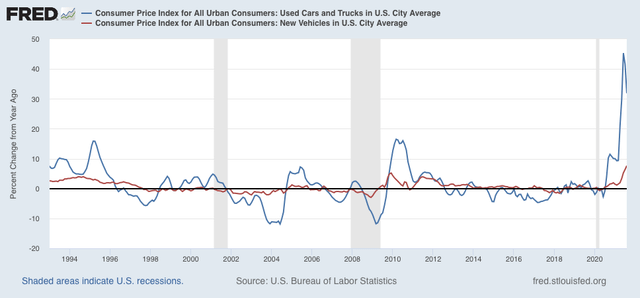
On a YoY basis, new car prices are still up nearly 10%, while used car prices are up over 30%!:

Almost certainly, price pressures in these two most important sectors of the consumer economy are now constraints going forward into 2022.

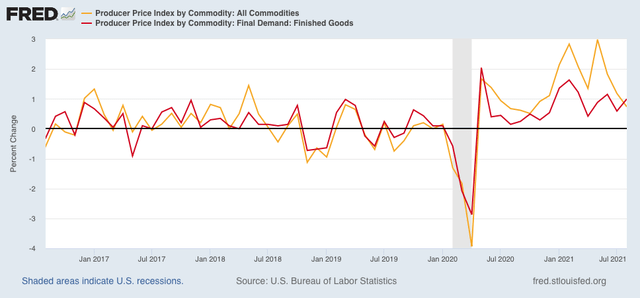
There is some limited good news “upstream” in commodities and finished consumer goods, as the former (gold in the graph below) increased a more “normal” 0.7% in August. While finished producer goods increased a fairly “hot” 1.0% (red):

Residential building materials for the second month in a row held almost steady:

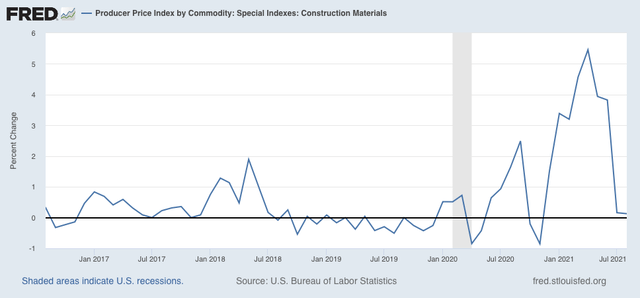
But they are still up over 30% YoY. We need this to decline, sharply, and soon.

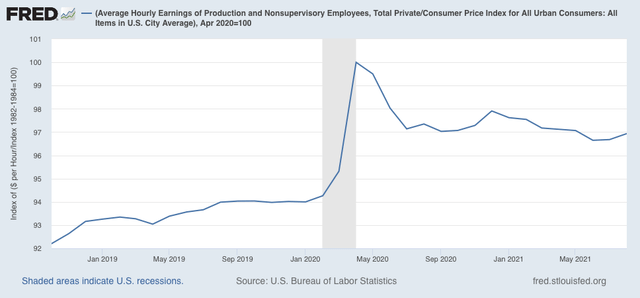
There is also some limited good news in the real wages department. Wages (more broadly, household income) failing to keep pace with inflation has been one of the tradition “real” harbingers of a recession:

After several months of decreases, real hourly wages, I.e., wages deflated by consumer prices, increased slightly in August. In the longer view real wages have been more or less flat in the past year, they are down about 3% from their pandemic peak:

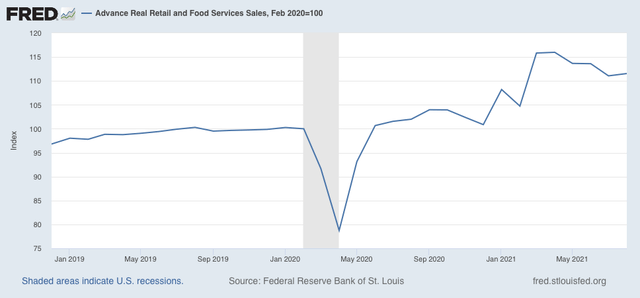
As indicated above, heightened inflation has gone on long enough now that I expect some damage to show up in consumer spending. We will get that information on Thursday with the report on retail sales.