Friday, January 24, 2020
The producer vs. consumer sectors of the economy: a comparison
- by New Deal democrat
I have a post up at Seeking Alpha, comparing current conditions on the producer side of the economy vs. the consumer side.
As usual, clicking over and reading should bring you up to date on the “nowcast,” and helps put a $ or two in my pocket.
Thursday, January 23, 2020
On the road
- by New Deal democrat
Today is a traveling day, so no detailed posting.
This morning’s initial jobless claims were in line with the range over the past two years. There has been virtually no change YoY. This negatives any imminent recession fears.
Yesterday’s existing home sales, though touted as “the best in nearly two years,” just continue the baseline that this metric has been in since late 2015, with the exception of the 2018 decline. Of more interest is that (1) inventory is at a cycle low, and - not coincidentally - YoY price increases, up 7.8%, show a continuing acceleration:
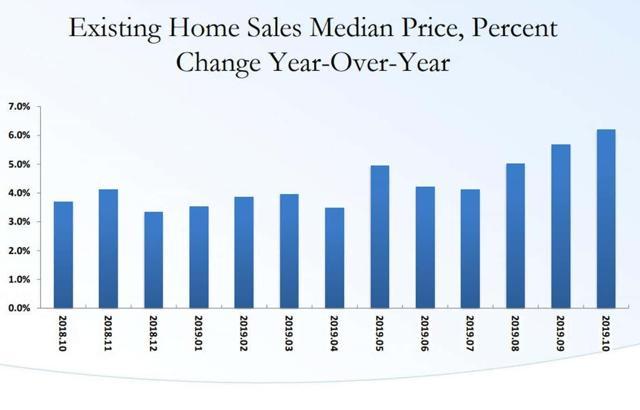
A few months ago I offered up the idea that housing now had its own “choke collar,” where prices were bumping up against the limit of what buyers in the aggregate could afford, even with lower interest rates. We’ll get much more information on whether that is the case when new home sales and prices are reported next week.
Wednesday, January 22, 2020
Why negative transportation indexes don’t support a recession call
- by New Deal democrat
Every month for at least the past half year there is a spate of bearish economic commentary that relies upon one or both of two metrics: AAR rail carloads and/or the Cass Freight Index.
I have a post up at Seeking Alpha showing why the first measure is not a representative slice of transport as a whole, and the second has a history of being very volatile and with a slew of negative readings in the teeth of continuing expansions.
As usual, clicking on the link and reading helps reward me with a $ or two for my efforts.
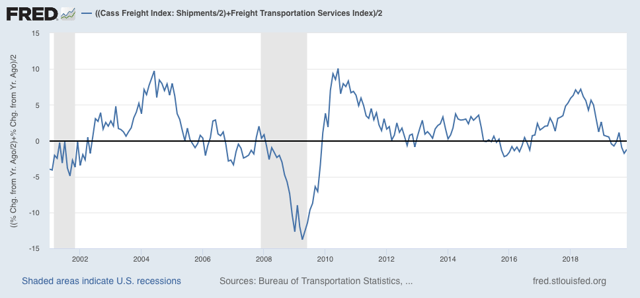
Addendum: after I put together and posted the article, I came up with the idea of averaging the Cass Freight Index and the Dept. of Transportation’s Freight Index after adjusting for the former’s volatility (shown below). It gives us an even less noisy overview of the transportation sector, although it still does go negative during slowdowns without there being a recession. In any event, none of the current negative readings are sufficiently below zero to accord with recessionary readings over the indexes’ short history:
Tuesday, January 21, 2020
Catching up: November JOLTS report
- by New Deal democrat
Let me catch up on some data I didn’t examine last week: the November JOLTS report.
It decomposes the jobs numbers into a number of metrics, but is less than 20 years old, so only covers one full business cycle, so is of limited forecasting use.
To reiterate, here is the order in which the JOLTS series peaked during the 2000s expansion:
- Hires peaked first, from December 2004 through September 2005
- Quits peaked next, in September 2005
- Layoffs and Discharges peaked next, from October 2005 through September 2006
- Openings peaked last, in April 2007
So to start, here are YoY hires and quits for the entirety of the series, measured YoY:
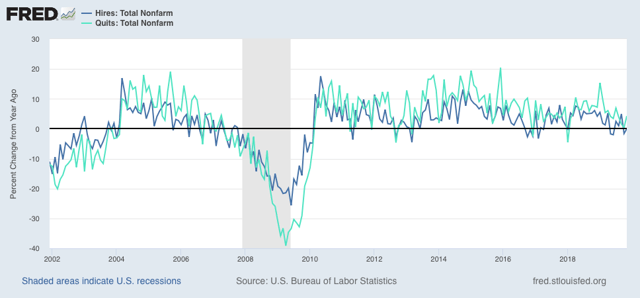
Hires has turned negative for some months in the past year, while quits remain positive YoY.
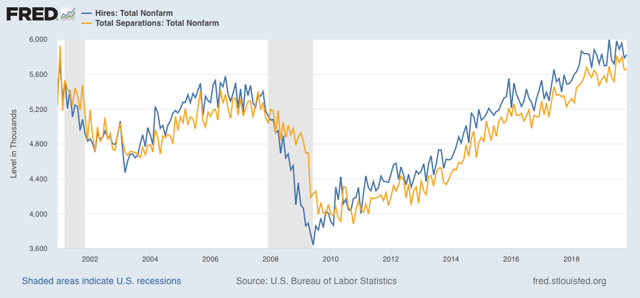
Next, as I have often said, hiring leads firing (actually, total separations). Here’s what that looks like for the entire series, first measured absolutely:
And here is the YoY change, plus the 4 week average of initial jobless claims (inverted) in red:
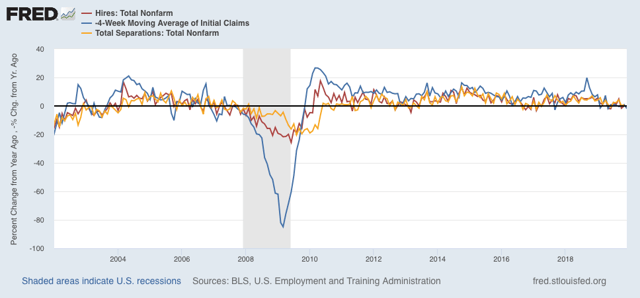
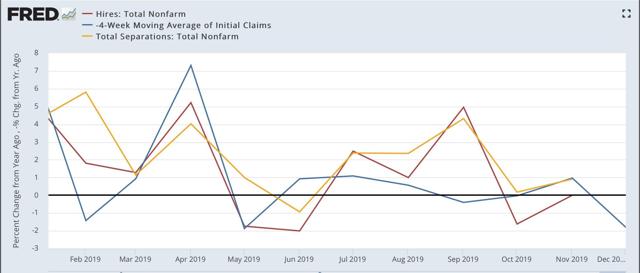
These aren’t as negative as prior to the 2007 recession, as compared in the two graphs below:
Present:
2007:
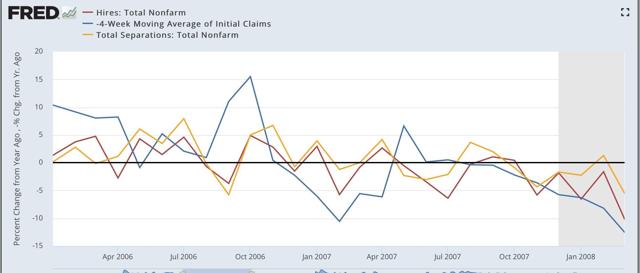
In 2007, both hires and initial jobless claims (inverted) were negative by as much as -5% YoY. In 2019, they’ve only been negative by about -2% at the worst.
The biggest difference between this cycle and the last has been in job openings, which I consider “soft data.” But because the difference is noteworthy, here it is, again shown YoY:
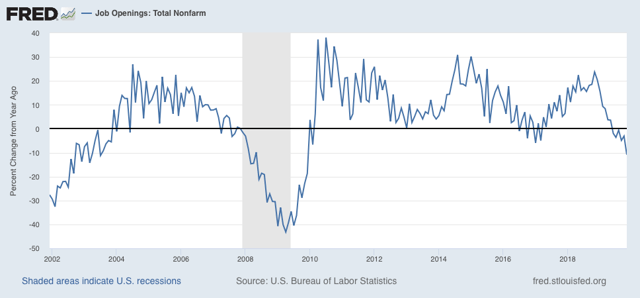
This series is consistent with its 2008 recessionary readings.
Again, analyzing with lots of caution, my take remains: slowdown, not recession at this point.
Monday, January 20, 2020
For MLK Day: unemployment by race
- by New Deal democrat
In observance of Martin Luther King’s birthday, almost all US markets are closed and there is no economic data.
So on this day let’s see the extent to which economic opportunity in several neutral metrics has improved since the passage of the Civil Rights Acts in the 1960s.
Here in unemployment for African Americans (blue) vs. whites (red) since the former began to be measured in 1972 (white unemployment had been measured since the 1950s - interesting that black unemployment wasn’t even deemed worthy of being separately measured before the 1970s!):
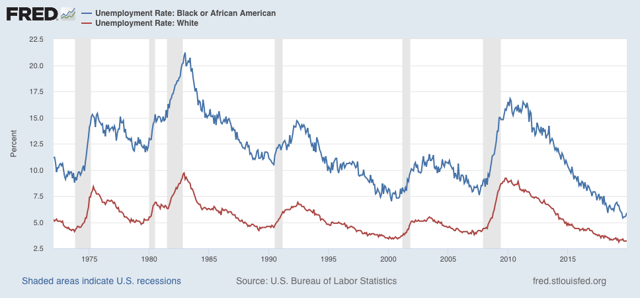
Unemployment for whites made a 50 year low at 3.1% earlier in 2019. It was only lower, at 3.0%, in 1969 (not shown). African American unemployment made its all time low, at 5.4%, in August of last year.
To get a clearer picture how the two measures compare, here are two other ways to look at the same data.
First, here is the % by which the black unemployment rate has exceeded the white unemployment rate:
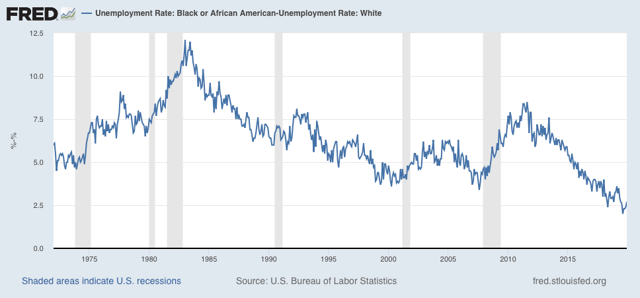
At the worst of the 1970s and 1980s, while white unemployment was bad, black unemployment exceeded it by over 10%! There has been general improvement in each expansion since, with black unemployment exceeding white unemployment by only 2% by last year.
Another good way to look at this is the black unemployment rate as a multiple of that for whites:
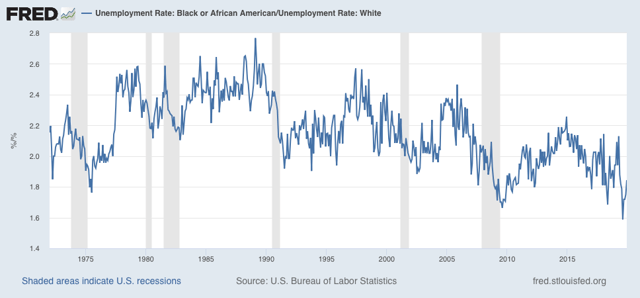
At its worst, black unemployment was more than 2.6x that of whites. The multiple has gradually improved so that last year it was only 1.6x that of whites.
The bottom line here is: progress over the past 50 years, but still a long way to go. At their rates of improvement over the past 40 years, the former measure will reach parity in about another 30 years; but at its historical rate of improvement the latter multiple would require about another 80 years.
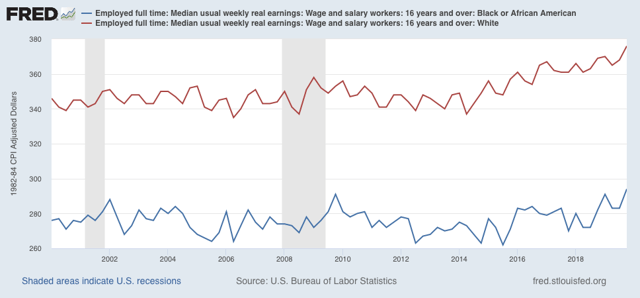
Finally, when it comes to wages, these have only been measured since 2000, and there is still roughly a 25% gap in average weekly wages:
Subscribe to:
Posts (Atom)