- by New Deal democrat
As an initial note, there is no economic news today, and for obvious reasons there won’t be on Thursday or Friday either, so don’t be surprised if I take a couple of days off as well.
In the meantime, I’ve been continuing to ponder why housing under construction remains close to its all-time, 50+ year record set one year ago, even though for the past year permits have been down 25% or more from their high set nearly two years ago, and so is the three month average of actual housing starts:
I did some rooting around over the weekend to see if I could find the reason for this seeming levitation, and found some surprising information.
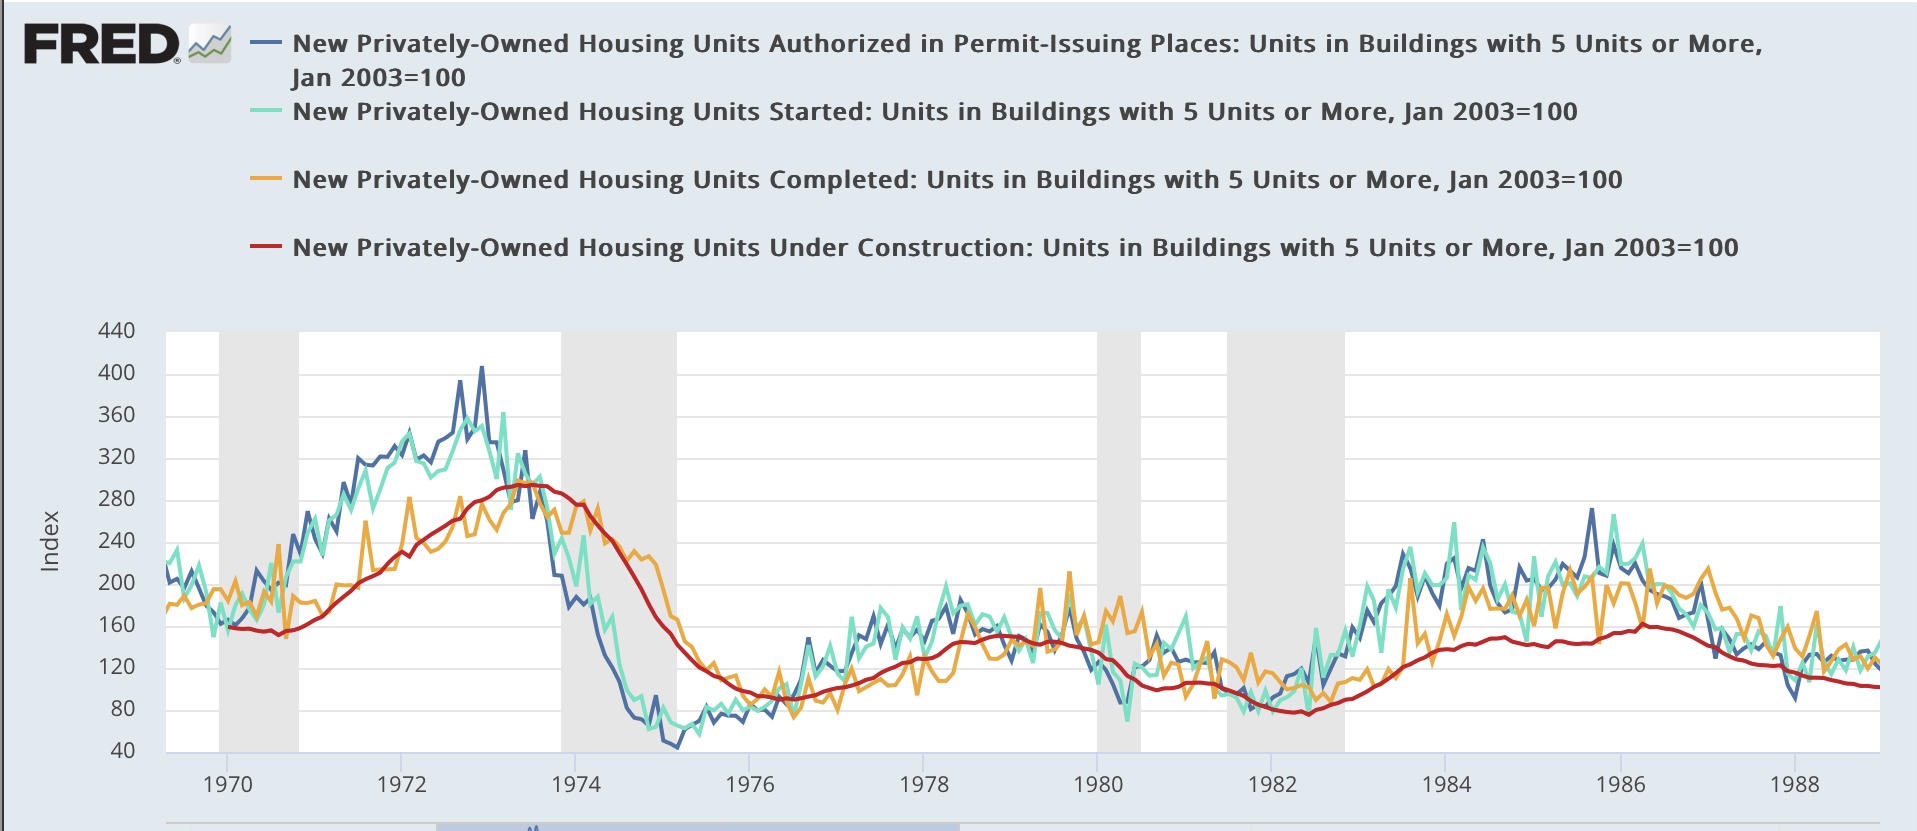
First off, here is a long term historical look at permits (dark blue), starts (light blue), completions (gold) and housing units under construction (red) from the inception of the series through 2003, for multi-family units:
As usual, housing starts are much more volatile than permits, but accord very closely. Completions and units under construction lag, generally by less than a year, but with the exception of a brief period in the mid-1980s, are also in accord with one another.
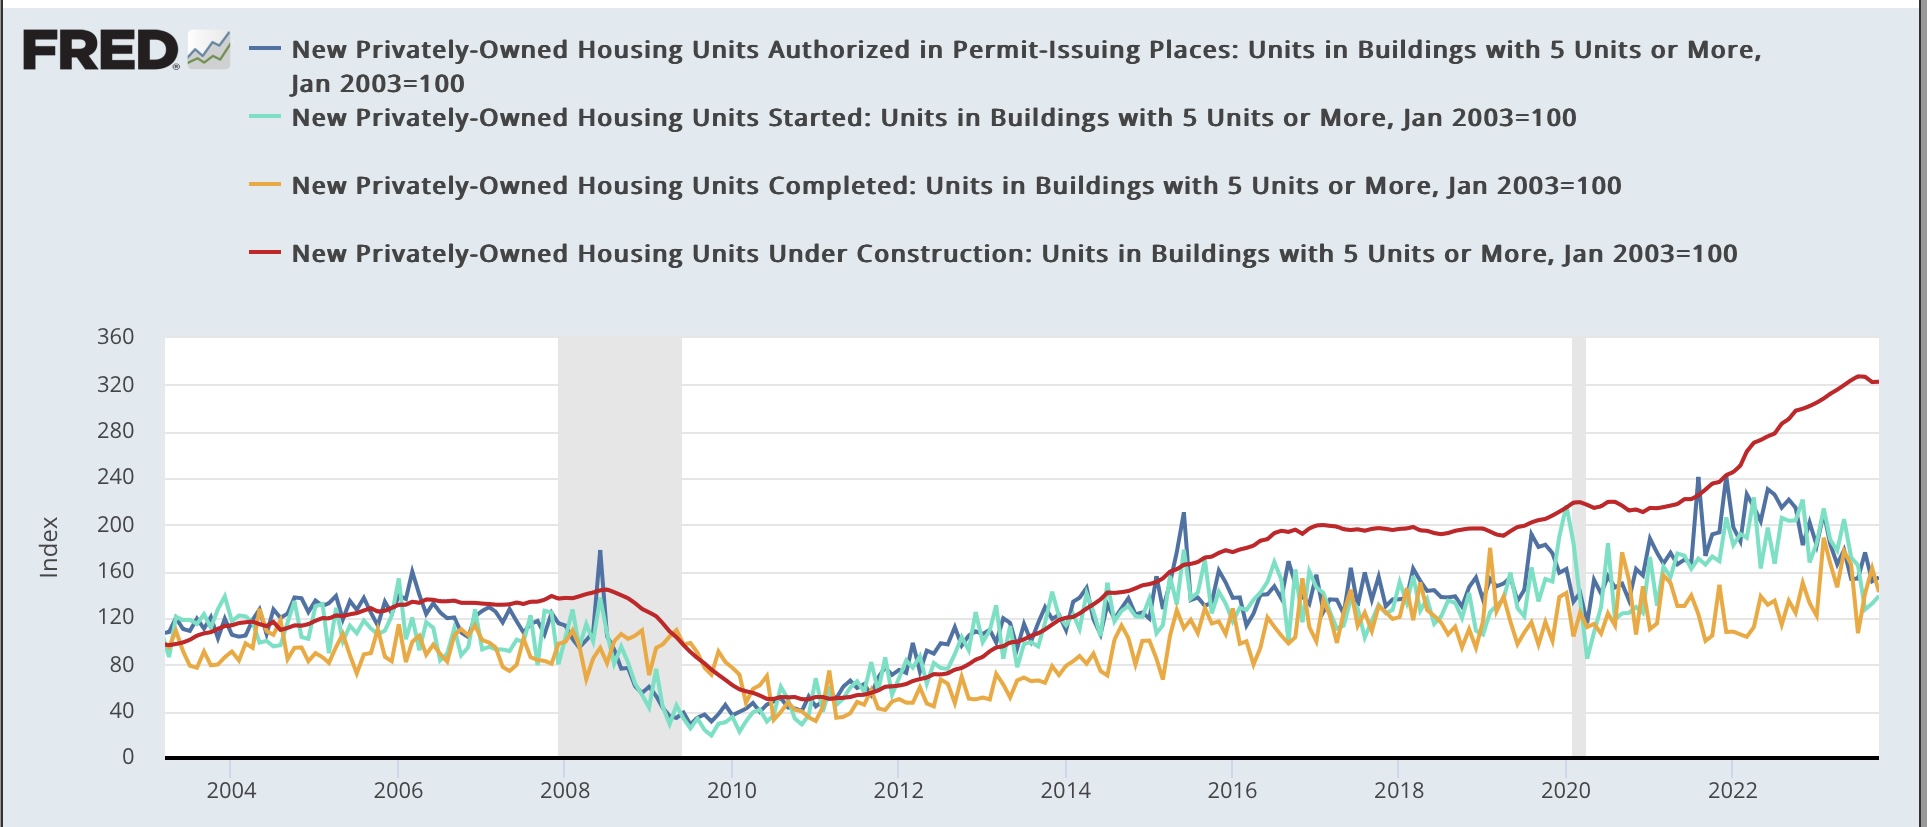
Now here is the same information since 2003:
Beginning in 2004, housing units under construction completely diverge from completions, and lag much longer. Multi-family units under construction did not peak until July 2008, more than *2 years* after the peak in multi-family permits in March 2006. Similarly, the three month average of multi-family permits peaked in June 2022 and is down almost 50% since then, even as the record pace of construction continues.
Clearly something of a secular nature started happening then.
the amount of time it takes to complete a multifamily project has also continued to rise.
According to the 2021 Survey of Construction from the Census Bureau, the average length of time to complete construction of a multifamily building — after obtaining authorization — has now risen to 17.5 months.
This authorization-to-completion time has been on an upward trend since 2013. However, the start-to-completion time has remained the same in recent years — evidence that the process of obtaining authorization to begin construction has gotten more burdensome and time consuming.
The average time to build multifamily homes varies significantly by region: The Northeast had the longest time (19.8 months), while the Midwest had the shortest (15.3 months). The number of units in the building is also a significant factor: Buildings with 20 or more units required the most time (19.2 months), compared to 2- to 4-unit buildings which took the least amount of time (14.2 months).
Except here’s the problem. The NAHB’s selection of 2013 as the starting date is almost one decade *after* the secular increase in the “start to completion time” of multi-family units under construction, as I’ve shown in the above graphs. And it turns out the NAHB might be cherry-picking to support their agenda.
One possibility might be that multi-family projects are simply much bigger than they used to be. In the past 15 years, I’ve seen lots of large 3, 4, and 5 story multi-family developments, vs. the 2 story “garden apartments” of the 1950s through 1980s. And maybe that has something to do with it - but couldn’t you simply hire more workers to get the larger jobs done in a similar timeframe?
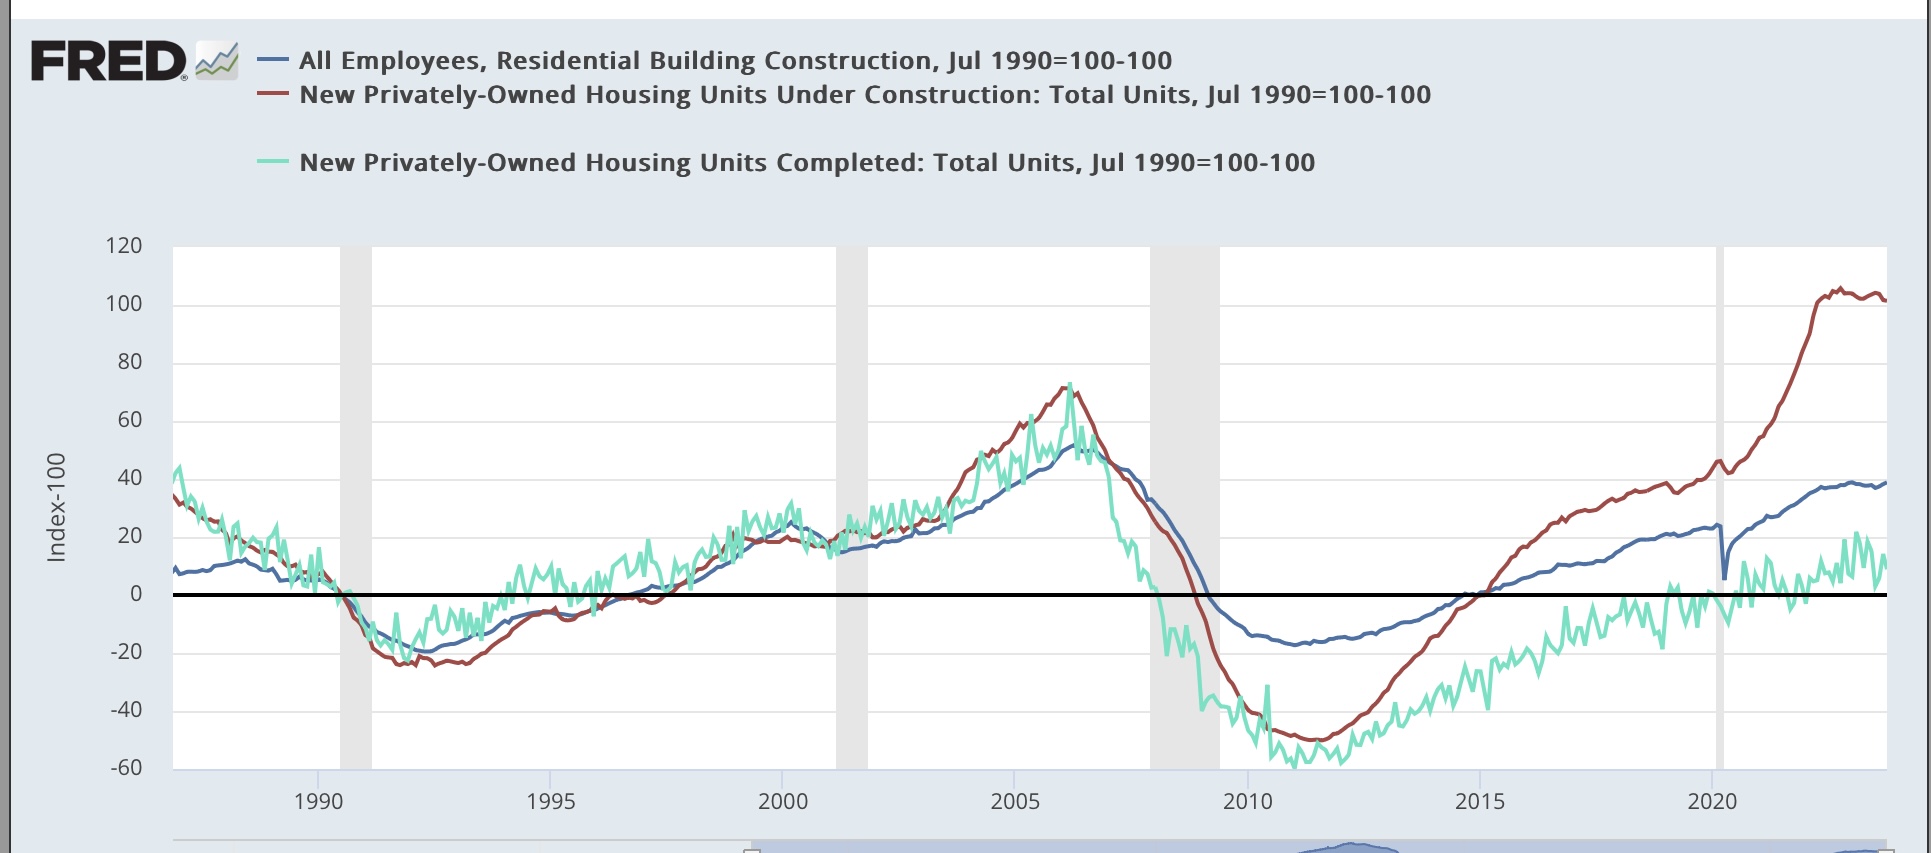
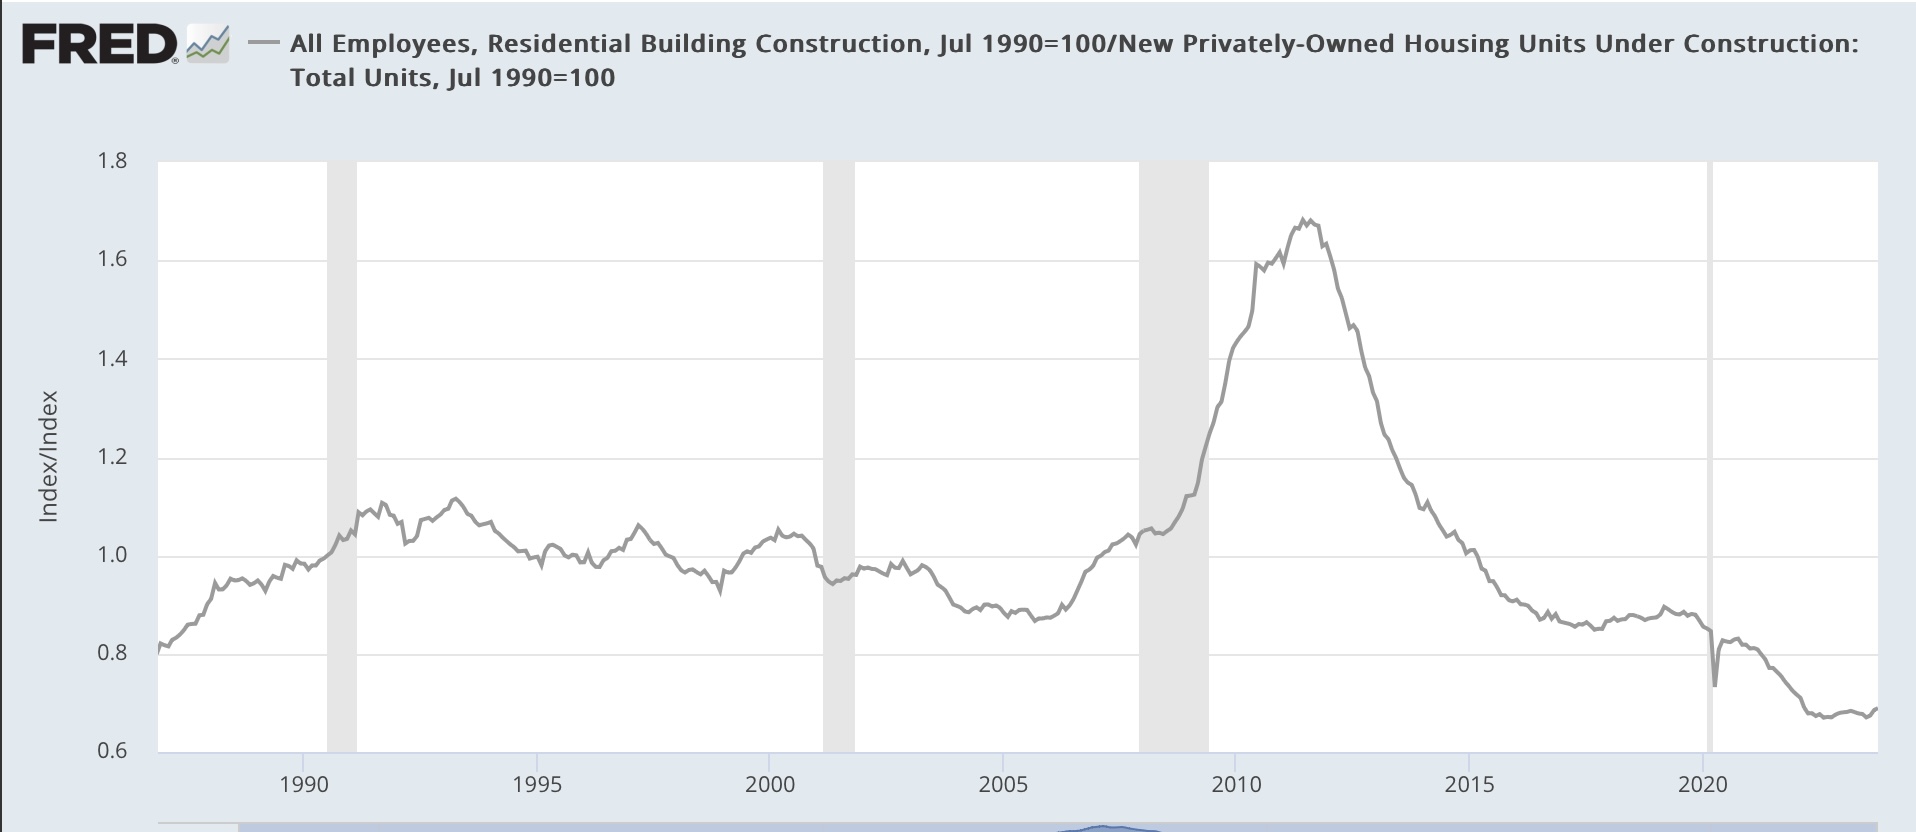
Well, the Census Bureau helpfully reports the number of workers involved in residential construction every month in the jobs report, dating since the late 1980s. So let’s compare that with the number of housing units under construction (note: because the jobs numbers do not break down workers between single family vs. multi-family construction, I am using total construction data):
And lo and behold! The number of workers involved in construction started to diverge from its previous trend in 2003, and has remained sharply divergent since the Great Recession. To better show just how divergent, I divided the number of total units under construction vs. the number of total workers doing the construction, and here is the ratio we get:
Compared with the 1989-2002 baseline, there were about 10% fewer employees per unit at the end of that housing boom. Layoffs during the Great Recession and thereafter did not keep pace with the huge downturn in construction. And since about 2015, the ratio of workers to units has continued to decline to the point where, since the pandemic, there are only 2/3’s of the number of workers per unit as there were in the baseline period.
Fewer workers per unit under construction means a longer time to get the job done. That seems to be the long and short of why multi-unit construction is taking so long to get done now, and is levitating near its all-time highs. Why that shortage in workers is the case is a much more opaque issue, but my suspicion is that it is not a coincidence that it has occurred as residential building construction has become more oligopolized.