Saturday, September 16, 2023

Weekly Indicators for September 11 - 15 at Seeking Alpha


 - by New Deal democrat


My Weekly Indicators post is up at Seeking Alpha.

The only significant change in any metric is that manufacturing, as measured by the average of the new orders sub-indexes of the regional Feds’ monthly reports is on the very cusp of improving from negative to neutral, due to a big improvement in the New York region.

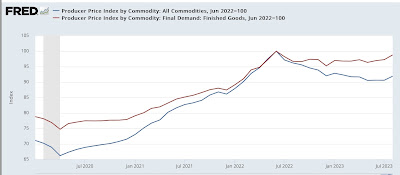
That improvement probably reflects the continued benefit of the big decline in commodity prices from mid-2022 until a couple of months ago. But the latest PPI, as well as the action in commodity indexes, suggests that has likely ended.

As usual, clicking over and reading wlll bring you up to the virtual moment as to the economy, and reward me a little bit for my efforts.

Friday, September 15, 2023

Has industrial production, the King of Coincident Indicators, been dethroned?


 - by New Deal democrat


Industrial production in the post-WW2 era was the King of Coincident Indicators. In the past 20 years, it may have been dethroned.


To wit, in August production increased 0.4% to a new post-pandemic high, but only 0.1% above its previous high last September. Meanwhile manufacturing production also increased, by 0.1%, but is still -0.9% below its post-pandemic peak last October:


Motor vehicle production (blue in the graph below) has been playing an outsized role in the recent improvement. Below I show it normed to 100 as of its 2017-2019 average. Production declined as much as -80% during the months immediately after the pandemic hit, and averaged -14% for all of 2020 and another -8% in 2021 before returning to 100% beginning in April 2022. Only since April of this year has the shortfall actually begun to be reduced, as production has averaged 10% higher than its 2017-19 average since then:


Meanwhile sales of light vehicles (red, including imports, so not directly comparable) are still running about -10% below their 2017-19 average.

In short, manufacturing ex-motor vehicles has been hit by the effects of Fed rate hikes, while vehicle manufacturing has been counterbalancing, and perhaps overcoming those effects, at least so far this year.

On a YoY basis, both total and manufacturing production are virtually unchanged:


In the past, this would almost always have meant a recession:


But note that since the 1980s, and especially since the Great Recession, such downturns in production have not been enough to tip the economy into recession. Construction and services are of greater importance now, which is one big reason I am paying so much attention to housing under actual construction, which will be reported next week.

Thursday, September 14, 2023

Real retail sales continue to be weak; continue to forecast weakening jobs reports


 - by New Deal democrat


As usual, retail sales is one of my favorite metrics because it tells us so much about the consumer and, indirectly, the labor market and the total economy.


Nominally, retail sales rose 0.6% in August. So did consumer inflation, and the difference rounded to -0.1% for the month. Here’s what the past 2.5 years since the 2021 stimulus look like (blue) compared with personal spending on goods deflated by the PCE goods deflator. Both are normed to 100 as of just before the pandemic:


Nominally both usually track close to one another; the difference is in the deflators. In any event, you can see that the trend in real retail sales for the past 12 to 16 months is flat to slightly declining. 

And it isn’t solely a function of gas prices. Nominally motor vehicle and parts sales (gold) rose 0.4% in August (note: in the graph below they are /2 for scale), and retail ex-gasoline (red) only rose 0.2%:


As a result, real retail sales are down -1.2% YoY. Although I won’t bother with a graph, over the past 75 years such YoY declines have more often than not occurred during a recession. Even so, despite being negative YoY for most of the past 12 months, needless to say no recession has occurred, at least not yet.

Finally, although there is a great deal of noise, the percent change in real retail sales YoY/2 typically forecasts the trend in monthly jobs reports. For over the past 18 months, that trend has been marked deceleration:


Needless to say, the forecast from real retail sales is that monthly gains in nonfarm payrolls will continue to decelerate further. It will be interesting to see if real spending on goods (gold) continues to diverge from retail sales. My bet would be on more of a convergence instead.

The economic tailwind from falling commodity prices has likely ended


 - by New Deal democrat


[Note: I’ll post on the August retail sales report later today.]

Two days ago in my PPI and CPI overview, I wrote “I am most interested in whether the producer price report tells us that the big decline in commodity prices is over. There have only been two increases in commodity prices in the past 12 months [ ] I suspect we’ll get #3 [on Thursday]. If producer prices have stopped declining, then the tailwind I have described above has ebbed, and maybe ended.”


As anticipated, that is just what happened. Commodity prices (blue below) rose 1.5% in August. July was also revised slightly so that it rounds to unchanged rather than a decline. The PPI for finished goods (red) also rose 2.1%:


PPI for finished goods is now up YoY by 2.2%, and is only -1.2% below its June 2022 peak:


And it isn’t only energy which has contributed to the end of the decline. Excluding energy, both intermediate and final goods production costs rose slightly:


My strong suspicion has been that the tailwind of declining commodity prices, typified by the big decline in gas prices in late 2022 is what allowed the US economy to grow so well so far this year, blunting the effects of major Fed interest rate hikes. If this tailwind is indeed over, only the accumulating headwinds will remain going forward.

Initial jobless claims maintain renewed yellow caution flag


 - by New Deal democrat


Some post-pandemic unresolved seasonality may be affecting the weekly claims figures, as just like last year, they are declining sharply compared with early August. But on a YoY basis, they are not nearly so positive.

Initial jobless claims rose 3,000 last week to 220,000. The 4 week average declined -5,000 to 224,500. With a one week delay, continuing claims (gold, right scale) rose 4,000 to 1.688 million:


On the YoY basis more important for forecasting purposes, initial claims are up 14.6%, the 4 week average up 11.8%, and continuing claims up 29.6%:


Remember that the “red line” is +12.5% sustained for 2 months. While the 4 week average has been up more than 10% for 3 weeks, justifying a “yellow” caution signal, it has not crossed 12.5%.

The most important metric of all for forecasting the unemployment rate is the monthly percentage change. Two weeks into September, it is up 14.8%. Should this be sustained for the month, that would imply the unemployment rate rising to 4% (about 1.15*3.5%) in the next few months:


This would come very close to triggering the Sahm rule. By no means are we there yet.

Wednesday, September 13, 2023

August consumer inflation confirms “Goldilocks” “soft landing” may well be “transitory”


 - by New Deal democrat


Let me start by quoting from my post yesterday:

“As to consumer prices, I am most interested in the relative weights of decelerating shelter increases (which as I have written many times are well-forecasted by the more current home price indexes and new rent indexes) vs. increasing gas prices 

“I suspect that the increase in gas prices is going to outweigh the deceleration in fictitious shelter inflation. If so, that will mean that there is an actual slight increase in a headwind in consumer prices.”

Not only did this happen, but the big increase in energy prices overwhelmed the continued slow decline in fictitious shelter. Further, the fallout from distortions in motor vehicle production also continued.

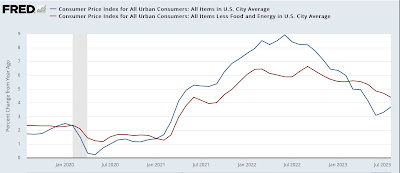
Let’s start with headline vs. core inflation. The former rose by 0.6% for the month and 3.7% YoY, up from 3.2% last month. The latter increased 0.3% for the month and 4.3% for the year, down from 4.7% last month:


As anticipated, the reason for the increase in headline inflation was a 5.6% monthly increase in energy (not shown), which is nevertheless still down -3.3% YoY.

But take out fictitious shelter, and prices are only up 1.9% YoY:


This is nevertheless higher than several months ago, when gas prices were at their most benign YoY.

Turning to fictitious shelter, it rose 0.3% for the month, including 0.4% for Owners Equivalent Rent. YoY shelter is up 7.6% and OER is up 7.3%, which continues its slow deceleration from 8.1% this past spring. In fact OER rose by the least monthly in two years:


Here is the update of OER compared with the Case Shiller and FHFA house price indexes (although I won’t show it, recall that apartment rent indexes are also now slightly *negative* YoY):


OER has been declining YoY at the leisurely pace of -0.2% per month, and the declines are going to continue. Still, if this rate of decline were to continue, it won’t return to 2% YoY for another 2 years, but I suspect there will be at least some acceleration in this rate of decline.

The other big distortion in inflation has been motor vehicles. I’ll discuss this further when industrial production is reported, but suffice it to say cumulative vehicle production since the pandemic struck is still probably about by about 10,000,000. While new vehicle prices rose 0.3% for the month, and are only up 2.9% YoY, and used vehicle prices declined once again, by -1.2% for the month, and are down -6.6% YoY, cumulatively they are up 20.5% and 39.9% since February 2020):


Because of the spike in vehicle prices, people have been holding on to their existing vehicles for longer and longer, and these older vehicles need more and more repairs. The gold line above shows that the costs of vehicle maintenance and repair is up 29.5% since February 2020. And it continues to rise at a rapid clip, up 1.1% in the last month alone and up 12.0% YoY (not shown). This is now the hottest single sector for inflation.

Since the Fed is focused on “sticky” prices, here’s what core, core minus shelter, and total less shelter look like YoY:


Excluding shelter, even “sticky” prices are only up 3.8%. Core “sticky” prices also excluding shelter are up 3.3%.

Finally, let’s update how inflation affected aggregate consumer wage income. Aggregate payrolls for nonsupervisory employees rose 0.5% in August, but since CPI rose 0.6%, real aggregate payrolls declined -0.1%, and are even with June. They remain up 2.0% YoY. Here’s what they look like normed to 100 one year ago:


This dynamic is what I have been concerned about. Namely, that wage gains will continue to decelerate, while consumer inflation as officially measured will at very least flatten if not re-accelerate with increasing gas prices. Once real aggregate payrolls peak, a recession has typically followed in about 6 months, coincident with their turning negative YoY. Additionally, any re-acceleration of CPI will give Fed hawks more ammunition to demand further rate hikes, which won’t even have their full effect for another year.

Tuesday, September 12, 2023

PPI and CPI preview: why Paul Krugman’s “Goldilocks” economy is likely to prove “transitory”


 - by New Deal democrat

Sorry for the lack of posting yesterday. Every now and then, real life intrudes and, well, yesterday was one of those days.

All of the economic data this week is going to be crammed into tomorrow through Friday. 

Most importantly for present purposes, I am very interested in dissecting both the producer and consumer price reports.

To give some background, I have taken the position that what has been, indeed, “very different” this time is that the very big - close to 10% - YoY decline in commodity prices has not been due to demand destruction, but rather to the unclogging of the post-pandemic supply pipeline.

Two graphs showed up yesterday in support of that proposition. First, Mike Konczai of the Roosevelt Institute decomposed sectors of the GDP to see whether each showed price declines, and if so, whether there was more or less demand. Less demand would mean demand destruction. More supply would mean an increase in quantity supplied. And here’s the result:


Particularly when it comes to goods, he wrote that 2/3’s of sectors showed increased demand. In short, the main driver of price declines was increased supply, not demand destruction.

Kevin Drum picked up on that with the below graph comparing the 3 month average of core inflation with the Goldman Sachs supply chain pressure index:


As he points out, inflation was already high before the 2021 stimulus ever took effect. And as supply chain pressure turned negative (below 0), the rate of inflation declined. 

This is simply very persuasive evidence that a great deal of the improvement in the economy in the past year has been the sharp disinflation due to the end of supply chain pressures (except possibly in the motor vehicle sector, which is its own story).

To return to the inflation reports, I am most interested in whether the producer price report tells us that the big decline in commodity prices is over. There have only been two increases in commodity prices in the past 12 months:


I suspect we’ll get #3 tomorrow. If producer prices have stopped declining, then the tailwind I have described above has ebbed, and maybe ended.

As to consumer prices, I am most interested in the relative weights of decelerating shelter increases (which as I have written many times are well-forecasted by the more current home price indexes and new rent indexes) vs. increasing gas prices (/10 for scale in the graph below):


I suspect that the increase in gas prices is going to outweigh the deceleration in fictitious shelter inflation. If so, that will mean that there is an actual slight increase in a headwind in consumer prices. Put that together with the fact that the effect of most of the Fed’s interest rate hikes have not been fully manifested in the economy yet, and the “immaculate disinflation” or “Goldilocks” economy as described by Paul Krugman in this morning’s NY Times is going to prove to be very, ahem, transitory.