Saturday, December 5, 2020

Weekly Indicators for November 30 - December 4 at Seeking Alpha


 - by New Deal democrat

My Weekly Indicators post is up at Seeking Alpha.

There is more evidence of weakening of the coincident data, probably as the result of the completely out of control pandemic. Some of that is probably due to new restrictions, some to winter weather causing people to curtail some activities, and some (probably most of all) to people becoming much more cautious about any activity that causes them to come into contract with others. 

As usual, clicking over and reading rewards me just a little bit for my efforts.

Friday, December 4, 2020

November jobs report: the “least positive” report since April


 - by New Deal democrat

HEADLINES:
  • 245,000 million jobs gained. The gains since May total about 55% of the 22.1 million job losses in March and April. The alternate, and more volatile measure in the household report indicated a loss of -74,000 jobs, which factors into the unemployment and underemployment rates below.
  • U3 unemployment rate fell -0.2% from 6.9% to 6.7%, compared with the January low of 3.5%.
  • U6 underemployment rate fell -0.1% from 12.1% to 12.0%, compared with the January low of 6.9%.
  • Those on temporary layoff decreased -441,000 to 2,764,,000.
  • Permanent job losers increased by 59,000 to 3,743,000.
  • September was revised upward by 39,000. October was  revised downward by -28,000 respectively, for a net gain of 11,000 jobs compared with previous reports.
Leading employment indicators of a slowdown or recession

I am still highlighting these because of their leading nature for the economy overall.  These were generally positive: 
  • the average manufacturing workweek declined -0.2 hours from 40.5 hours to 40.3 hours. This is one of the 10 components of the LEI and will be a negative.
  • Manufacturing jobs increased by 27,000. Manufacturing has still lost -599,000  jobs in the past 9 months, or -4.7% of the total. About 55% of the total loss of 10.6% has been regained.
  • Construction jobs increased by 27,000. Even so, in the past 9 months -279,000 construction jobs have been lost, -3.7% of the total. About 75% of the worst loss of 15.2% loss has been regained.
  • Residential construction jobs, which are even more leading, rose by 1,300. In the past 9 months there have still been 6,100 lost jobs, or about -0.7% of the total.
  • temporary jobs rose by 32,200. Since February, there have still been -293,200 jobs lost, or -10% of all temporary help jobs.
  • the number of people unemployed for 5 weeks or less fell by -33,000 to  million, compared with April’s total of 14.283 million.
  • Professional and business employment rose by 60,000, which is still -1,061,000, or about -5.0% below its February peak.

Wages of non-managerial workers
  • Average Hourly Earnings for Production and Nonsupervisory Personnel: rose $0.07 from $24.80 to $24.87, which is a gain of 3.8% in the 9 months since the pandemic began. Gains had previously reflected that job losses were primarily among lower wage earners, who have been disproportionately recalled to work. That we have increased employment and increased wages as well is a very positive development.

Aggregate hours and wages:
  • the index of aggregate hours worked for non-managerial workers rose by 0.3%. In the past 9 months combined this has nevertheless fallen by about -6.0%.
  •  the index of aggregate payrolls for non-managerial workers rose by 0.6%. In the past 9 months combined this has nevertheless fallen by about -2.4%. About 85% of the loss from February to April has been made back up.

Other significant data:
  • Full time jobs gained 752,000 in the household report.
  • Part time jobs declined -779,000 in the household report.
  • The number of job holders who were part time for economic reasons decreased by -23,000 to 6.660 million. This is still an increase since February of 2,342,000.

SUMMARY

This was a mixed report. Most of the headlines were positive, but there were several important internal weaknesses. Most importantly, permanent layoffs increased, and the manufacturing workweek declined. This is a warning that the manufacturing surge may be ebbing, while temporary job losses are metastasizing into permanent ones. The headline number of job gains was by far the least positive of any gains since April.

On the other hand, all of the other leading job categories showed increases in employment. Additionally, both average and aggregate hours and payrolls continued to increase pretty strongly. Aggregate payrolls are back where they were a year ago (of course, inflation has eaten away at some of that rebound).

The overall tone remained positive - but the “least positive” of the last 6 months.

UPDATE:  One thing I neglected to mention was that there were -99,000 government job losses. Without those, the gain in employment would have been 344,000. Better, but still the “least positive” number since April. 


Thursday, December 3, 2020

Jobless claims have best pandemic week yet


 - by New Deal democrat

This week’s new jobless claims decreased close to their pandemic lows, while the unadjusted and 4 week averages did make new pandemic lows, as did continuing claims.

On a unadjusted basis, new jobless claims fell by 122,453 to 713,824. Seasonally adjusted claims declined by 75,000 to 712,000, still 1,000 higher than their pandemic lows three weeks ago. The 4 week moving average also fell by 11,250 to 739,500. Here is the close up since the end of July (for comparison, remember that these numbers were in the range of 5 to 7 million at their worst in early April): 


Continuing claims historically lag initial claims typically by a few weeks to several months. On an unadjusted basis, they declined by 690,170 to 5,240,575. With seasonal adjustment they declined by 569,000 to 5,520,000, both new pandemic lows:


Seasonally adjusted new jobless claims have declined almost 90% from their March and April pandemic high, and continuing claims have declined over 75% from their April high:


Initial claims remain about 50,000 higher than their worst levels of the Great Recession, while continuing claims have actually dipped about 1 million less than their worst levels.

Last week I wrote that “It appears increasingly likely that two weeks ago will mark an interim low, due to the pandemic spiraling out of control again in most of the country.”  This week’s data shows that to be incorrect, as all measures made new pandemic lows, except for seasonally adjusted initial claims, which missed by 1,000.

Still, as the below graph of the YoY% change in initial claims shows, on a YoY basis, progress stopped in November:


We’re likely to get another positive number in tomorrow’s November jobs report, but my guess is it will be the weakest reading of the past 6 months. I still suspect the near term trajectory in new jobless claims is going to be poorer.

Wednesday, December 2, 2020

First look at the 2021 economy: housing


 - by New Deal democrat

As I’ve pointed out for years, housing is a long leading indicator. It can give us a decent read on the direction of the overall economy 12 to 18 months out.

So the strength in the housing market in the past 6 months has been a powerful positive omen for the economy going into 2021.

Yesterday residential construction spending for October was reported, and continued that string of very positive signs. The below graph compares inflation-adjusted residential construction spending with single family housing permits since the construction series began in 2002:

These are the two least volatile of all of the housing metrics. Since sales have to be made first, and permits obtained, before construction starts, typically construction - while the least volatile of all metrics - lags permits somewhat. But right now, both are at 10 year+ highs.

I put together a much more comprehensive overview of the housing market, including mortgage rates, sales, prices, and inventory, and it is posted at Seeking Alpha.

As usual, clicking over and reading puts a penny or two in my pocket to reward me for my efforts, as well as giving you useful economic information about the future.

Tuesday, December 1, 2020

November data starts out strong with a very positive ISM manufacturing index


 - by New Deal democrat

The first November data point, the ISM manufacturing index, was reported this morning, and while it declined from last month, it remained very strongly positive.


The overall index declined from 59.3 to 57.5, and the more forward-looking new orders index declined from 67.9 to 65.1:


Since any reading above 50, however, indicates expansion, these were positive readings. The overall index is at levels equivalent to where it was during the strongest parts of the last decade’s expansion, and this month, like 3 of the last 4 months, the new orders component is equal to its strongest levels of the past 16 years.

Manufacturing has been very strong in the last half of this year, and as a short leading indicator, the ISM manufacturing index suggests that strength is going to continue in the first part of next year as well.

In general both the short and long leading indicators are very positive for 2021. I am putting together detailed posts to that effect which will be up at Seeking Alpha, and to which I will link here.

Monday, November 30, 2020

Coronavirus dashboard for November 30


 - by New Deal democrat

Total US confirmed infections: 13,383,320*
Average US infections last 7 days: 162,365 (vs. latest low of 34,354 on Sept 12)
Total US deaths: 266,873
Average US deaths last 7 days: 1,430 (vs. latest low of 701 on Oct 16)

*I suspect the real number is 18-19,000,000, or between 5 to 6% of the total US population
Source: COVID Tracking Project


Infections are out of control over much, if not most, of the country. North and South Dakota, the 2 worst States, now have had confirmed infections in over 10% and over 9% of their entire populations (and probably much worse than that since many asymptomatic cases go undetected):


While the earliest hard hit States, NY and NJ, still have had the highest death tolls, 8 more States have suffered fatalities in excess of 1 in 1000 of their total populations:


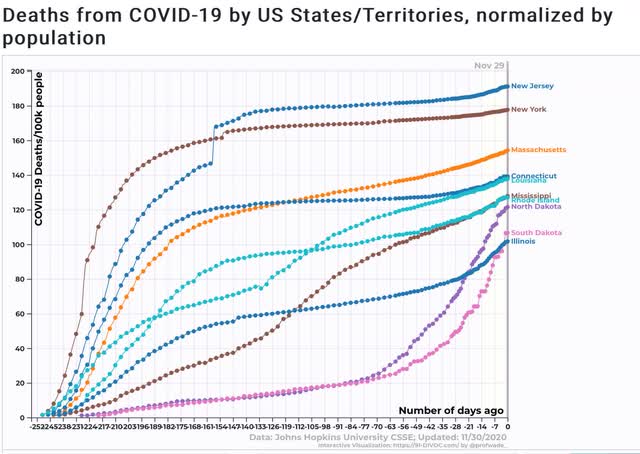
While the Dakotas’ death tolls per capita are increasing the fastest, Mississippi, Rhode Island, and Illinois are also increasing sharply.

Turning to current infections, in the past week these have averaged between 80 to 115 per 100,000 residents on a daily basis in the 10 hardest hit States:


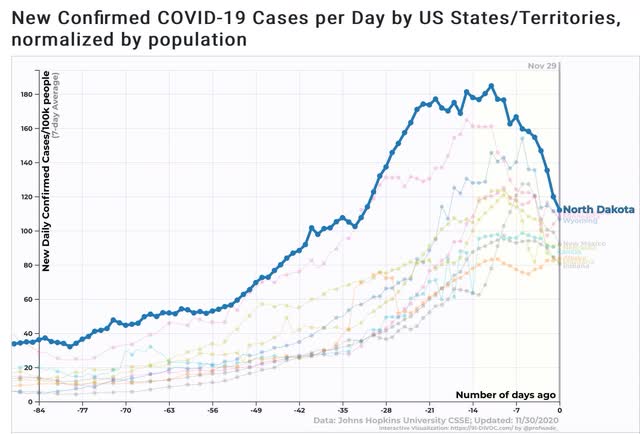
There is a slight silver lining here, in that in 6 of these 10 States - North and South Dakota, Minnesota, Nebraska, Indiana, and Montana - peak infections occurred between November 14 to November 20, one to two weeks *before* Thanksgiving. In other words, the decline is not just an artifact of low reporting over the Thanksgiving holiday weekend. It seems more likely that the “libertarian” northern Great Plains States finally reached their pain threshold, where the population is frightened enough to change to more safe behaviors. Still, the death toll in those States can be expected to rise over the next several weeks, and it seems likely that the Dakotas at least will surpass the total per capita death tolls of NY and NJ by Christmas.

At the other end of the spectrum, there is a little “less bad” if not outright good news. Maine, Vermont, and Hawaii continue to have infection rates on par or even better than Canada, which is the benchmark success story among North American countries:


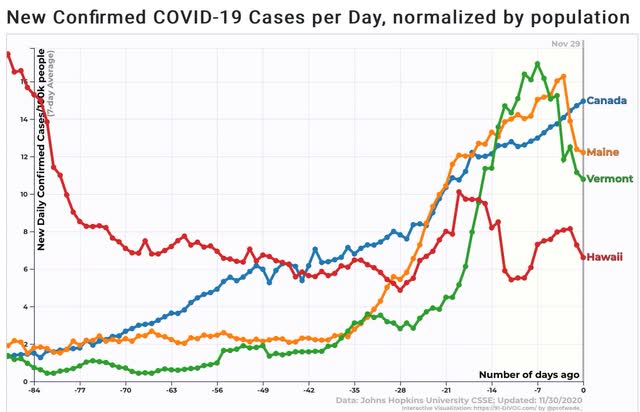
Hawaii in particular continues to appear successful in keeping the pandemic under control.