Saturday, June 30, 2012
Weekly Indicators: if we're not in a recession now, ECRI was wrong edition
- by New Deal democrat
Tomorrow begins July, meaning that we have arrived at midyear, the point by which ECRI predicted we would enter a new recession. While we don't have the June data, as of May real income, payrolls, and real retail sales continued to rise, although retail sales are below their March peak. Industrial production was off slightly in May from its post recession peak in April.
In monthly data released last week, new home sales continued their recent improvement, making a 2 year high. The Case-Shiller index of repeat home sales after adjusting for seasonality still improved slightly for the third month in a row. Durable goods orders increased although their overall trend is still sideways. The Chicago PMI remained slightly positive. Consumer confidence continued to fade. Consumer spending was flat, but as indicated above consumer income improved.
Overall the high frequency weekly indicators were weakly positive in the past week, with the more leading components more positive than the more coincident ones. Since June payrolls will be reported next Friday, let's start with those and the more coincident indicators.
Employment related indicators were weak:
The Department of Labor reported that Initial jobless claims fell 1,000 to 386,000 last week. The four week average rose 500 to 386,750. The rise in jobless claims is a serious concern, but there remains some question of whether there is a seasonal adjustment issue or whether something more ominous is going on, as we had a similar rise during the second quarter of 2011.
The Daily Treasury Statement for the first 20 days of June showed $132.0B vs. $127.5B for the same period in 2011, an increase of $4.5B, or +3.5%. The YoY growth in ax receipts has lessened in the last few months although it remains positive.
The American Staffing Association Index remained at 93. This index has been flat for the last two months, mirroring its 2nd quarter flatness last year.
Rail traffic continued its recent more positive turn this week.
The American Association of Railroads reported a +3.0% increase in total traffic YoY, or +15,400 cars, at 534,900. Non-intermodal rail carloads were up 1.4% YoY at 288,700, as coal hauling leveled off YoY. Intermodal traffic was up 4.8% YoY at 246,100. Nine of the 20 carload types were negative YoY vs. 8 types one week ago.
Same Store Sales have weakened significantly.
The ICSC reported that same store sales for the week ending June 23 were up 2% w/w, and were up +2.7% YoY. Johnson Redbook reported a 1.9% YoY gain. Shoppertrak did not report last week. The 14 day average of Gallup daily consumer spending at $69 was barely positive compared with $68 last year. This is the third week in a row in which consumer spending has weakened significantly, barely if at all improving YoY. A few months back I noted that YoY consumer spending had consistently run better than 2.0% for the duration of the recovery. Gallup has now declined under that for the entire month. Johnson Redbook is under 2%, and Shoppertrak's last few reports have also been dismal. The consumer is wavering.
Housing reports continued positive although not quite so strong:
The Mortgage Bankers' Association reported that the seasonally adjusted Purchase Index fell 1% from the week prior, and was down 3% YoY, back into the middle part of its two year range. The Refinance Index fell 8%, but it still close to its 3 year high set one week ago.
The Federal Reserve Bank's weekly H8 report of real estate loans, which turned positive YoY in March after having been negative for 4 years, this week rose 0.1%, and the YoY comparison improved to +0.9%. On a seasonally adjusted basis, these bottomed in September and remain up +1.0%. The YoY growth rate has weakened in the last few weeks.
YoY weekly median asking house prices from 54 metropolitan areas at Housing Tracker were up + 2.1% from a year ago. YoY asking prices have been positive for 7 months, remain higher than at any point last year, and at their maximum seasonal point on a seasonally adjusted basis. Only the possibility that the long-in-coming foreclosure tsunami might finally materialize remains as a reason to think we have not seen the bottom in housing prices.
Money supply was mixed but continued very positive on a YoY basis:
M1 fell -1.0% last week, and was flat month over month. Its YoY growth rate declined to +15.7%, so Real M1 is up 14.0%. YoY. M2 fell -0.3% for the week, but was up 0.4% month/month. Its YoY growth fell slightly +9.4%, so Real M2 grew at +7.7%. Real money supply indicators continue to be strong positives on a YoY basis, and after slowing earlier this year, have increased again.
Bond prices were mixed and credit spreads declined:
Weekly BAA commercial bond rates decreased by .03% to 5.02%. Yields on 10 year treasury bonds rose .02% to 1.64%. The credit spread between the two fell to 3.38%, just above its new 52 week low set last week. The recent collapse in government bond yields shows fear of deflation due to economic weakness. Corporate yields have not followed.
The energy choke collar has disengaged:
Gasoline prices fell for the tenth straight week, down another .09 to $3.44. Oil prices per barrel rose sharply on Friday, so that for the week Oil rose over $5 from $79.76 to $84.96. Ex-Friday, Oil has only been less expensive for about 2 months in the last 3 years. Oil prices remain well below the point where they start to constrict the economy, and gasoline has followed. The 4 week average of Gasoline usage, at 8829 M gallons vs. 9278 M a year ago, was off -4.8%. For the week, 8840 M gallons were used vs. 9261 M a year ago, for a decline of -4.5%. This is a significant YoY decline; however, June and early July of 2011 were the only months after March 2011 where there was a YoY increase in usage, so the YoY comparison now is especially difficult. If this decline persists past the middle of July, it will be a red flag.
Turning now to high frequency indicators for the global economy:
The TED spread declined 0.1 to 0.38, in the middle of its recent 4 month range. This index remains slightly below its 2010 peak. The one month LIBOR rose another 0.001 to 0.246. It has risen slightly above its recent 4 month range, it remains well below its 2010 peak, and has still within its typical background reading of the last 3 years.
The Baltic Dry Index rose another 26 from 978 to 1004. It remains 334 points above its February 52 week low of 670. The Harpex Shipping Index fell for the fourth straight week from 447 to 438, but is still up 63 from its February low of 375.
Finally, the JoC ECRI industrial commodities index rebounded slightly from its recent cliff-dive, up from 113.89 to 114.53. This is just above its 52 week low. Its recent 10%+ downturn during the last few months is is a strong sign of all that the globe taken as a whole is slipping back into recession.
The best comparisons are found in money supply, bond yields, and housing. All of these are long leading indicators. Low gas prices are helping to fatten the consumer's wallet, as is the continuing surge in refinancing activity. The weakest are the short leading indicators of jobless claims, credit spreads, and industrial commodities. Payroll related data is weakly positive to weakly negative, portending a poor June payrolls report. I would not rule out a negative number. Consumer spending is also weakening. Rail traffic, however, has been turning more positive.
All things considered, it appears that this summer, like the summers of 2010 and 2011, will likely be the weakest point of the year. Deflation now should set up a rebound later. Turning to the title of this week's piece, while I suspect it will be touch and go for a couple more months, I continue to believe that ECRI's prediction will ultimately be proven wrong.
Have a nice weekend.
Thursday, June 28, 2012
It's Long Weekend Time
Hey all
This is Bonddad. I'm taking a long weekend this weekend (actually, my allergies kicked-up and now I have a really annoying head and chest cold).
So -- NDD will be here on Saturday and I'll be back on Monday.


This is Bonddad. I'm taking a long weekend this weekend (actually, my allergies kicked-up and now I have a really annoying head and chest cold).
So -- NDD will be here on Saturday and I'll be back on Monday.


Holy Cow -- The SC Upheld the ACA
I have to admit, I and NDD had a post ready to go up in the event the court over-turned the ACA. However, that is not necessary for obvious reasons.
As an aside, I think that Roberts voted for the act, largely because he was concerned about the Supreme Court's stature in the US as a whole. Had the ACA been voted down, the court would have been seen as far more partisan -- and therefore less relevant and important. I also think he saw the political landscape as one where there was no hope for health reform should the law be voted down.
I'm very pleased by this development, happy the law was upheld, and am glad this nonsense is over.
Have a good day.
------------
NDD here -- Here's what I wrote, regardless of the actual ruling:
>>The only way to solve the problem is at the national level, which is clearly within the commerce clause.
>>If the pharmaceutical and health care insurance industries aren't "interstate commerce", I don't know what is. Medical care expenses constitute 15% of GDP, about 5% more than any other industrialized country. There are no intrastate pharmaceutical manufacturers. The field is dominated by a few very large international companies. Similarly, there are only a few, nationwide health care insurers who dominate the field. Even the hospital system is becoming more concentrated and dominated by a decreasing number of providers, who frequently have multiple locations in metropolitan areas spanning several states.
>>So the idea that health care as a whole is anything other than the largest single component of interstate commerce is laughable. That spiraling medical costs from this interstate, even international system, is anything other than a crisis that demands an federal solution is similarly laughable. If ever there was something within Congress's delegated power to regulate interstate commerce, this is it.
>>Indeed, if individual states attempted to rein in medical costs as Congress has attempted to do under the ACA, it is unclear to say the least if those statutes could withstand Constitutional challenge themselves, as unduly burdening interstate commerce (the reason that state level Usury statutes were largely gutted by the Supreme Court in 1978).
>>Further, so long as the means of implementing that regulation of interstate commerce are reasonable and do not impinge on other substantive Constitutional protections -- such as the right to privacy, which even though Justice Scalia doesn't like it, is the reason that I can't be forced to eat broccoli -- there ought to be no question that the legislation is valid.<<
With the exception of Chief Justice Roberts, the opinion broke exactly the way partisans expected it to break immediately after oral argument. There are four reactionary Justices who want to repeal the New Deal. There are four liberal justices who are in favor of maintaining the precedents from the last 75 years. I agree with Bonddad's first impression (which by the way is shared by at least one reactionary partisan) that Roberts joined the liberal Justices because of the likely devastation to the Court's reputation had the opinion been seen - accurately in my opinion - as enshrining reactionary partisan loyalty as constitutional Dogma. Keep in mind that the price for that was the 5-4 ruling that places new restrictions on Congress's power to regulate interstate commerce.
Those are my immediate impressions, subject to more patient reflection.
Morning Market Analysis

The industrial metals ETF has been dropping since the beginning of March, falling from a level of 21.5 to 17.5 -- a drop of nearly 18.6%. Also note that no price level seems to be providing any technical support and that the EMAs are using resistance rather than support. Momentum is weak and negative and the relative prices are weak as well.

The weekly gold chart is still holding at the 150/155 level.

The yen was in an upward sloping rally from mid-March to early June. However, prices have since broken the trend and are now moving sideways. Pay particular attention to the EMAs; they are tightly bunched and all inter-twined around the 200 day EMA. The underlying technicals tell as that a move lower is more likely -- the MACD has given a sell signal and is moving lower while the CMF shows money leaving the market.

The pound is still trading between the 152 and 162 level. However, note the MACD and CMF both indicate that a move lower over the longer term is more likely. The real key to this chart is the152 price level; should that break, prices have a long way to go.
Wednesday, June 27, 2012
What's Up With Australia?
From the Conference Board:

Let's go to the latest policy announcement from the RBA to get an overview of their economy:
Overall, this report looked very much like the US consumer economy; weaker confidence plus some (but not) great growth in overall retail sales.
Here's a chart of Australian business confidence:

The drop is concerning. I'm guess that most of it is related to the China slowdown.

The above chart shows Australia's overall unemployment rate, which is solid by comparison to literally everybody else. However, note again that the Australian economy is a bit of a "one trick pony;" mining/natural resources are booming and everybody else is limping.
The above wage gains are impressive, and are probably largely caused by the economy being near full employment. The only way for a company to attract workers in the current environment is through increasing wages.
Overall, things are OK, but not great. Most importantly, the one-sided nature of their economy is a big problem right now, as a consensus is emerging that China is now looking to shift their economy from one driven by manufacturing and trade to one driven by internal demand.
The good thing about Australia is their Central Bank Board, which recently lowered rates in response to the declining situation. As noted by the Money Illuision Blog:
The Conference Board LEI for Australia fell sharply in April led by a large decline in building approvals (April’s significant drop in the housing indicator was mainly due to a temporary interruption in approval processing), and there were downward revisions to the past few months as actual data for sales to inventories ratio* and gross operating surplus* for the first quarter of 2012 became available. With this month’s decline, the six-month change in the leading economic index remained negative at 2.8 percent (about a -5.5 percent annual rate) between October 2011 and April 2012, significantly down from the increase of 1.0 percent (about a 1.9 percent annual rate) during the previous six months. In addition, the weaknesses among the leading indicators have been somewhat more widespread than the strengths in recent monthsConsider this chart from the same report:

Let's go to the latest policy announcement from the RBA to get an overview of their economy:
Members noted that indicators of recent economic activity had been mixed but, on balance, suggested continued moderate growth. Taking the past two months together, ABS data suggested a pick-up in the growth rate of retail sales; nominal retail sales declined by 0.2 per cent in April, but this had followed a strong rise of 1.1 per cent in March. Consumer confidence rose slightly in May, but remained below its long-run average level. In aggregate, housing prices continued to decline and activity in the housing market remained weak, with a sharp fall in dwelling approvals in April partly accentuated by the introduction of new legislative guidelines in Western Australia
Overall, this report looked very much like the US consumer economy; weaker confidence plus some (but not) great growth in overall retail sales.
Surveys of business conditions generally fell in April, to average or below-average levels. Much of the reported strength in business conditions continued to be in mining-related and transport industries, with the weakness concentrated in the retail, construction and manufacturing industries. Members were briefed on the March quarter capital expenditure survey, which suggested a continuation of the very large pipeline of committed mining investment in coming years, notwithstanding recent announcements by some mining companies that they were re-considering the viability of a number of resource projects to which they had not yet committed. The data also showed that non-mining investment intentions remained weak. The pace of business credit had been increasing gradually to an annualised rate of around 4 per cent over the six months to April.Australia's economy has two sectors: mining/natural resources and everybody else. With China right around the corner, Australian natural resource companies have a natural market for their goods. However, note that China is now becoming a less-then competitive manufacturer because of rising wages. This is part of the overall reason for their latest slowdown, which in turn is having an impact on the suppliers of China's raw materials. This explains why miners are going to continue with current expansion plans, but are rethinking expansion that is only theoretical right now.
Here's a chart of Australian business confidence:
The drop is concerning. I'm guess that most of it is related to the China slowdown.
Some modest strengthening in the labour market over the year to date was apparent, as employment increased by 15,000 in April, the unemployment rate declined to below 5 per cent and the trend measure of average hours worked edged up. However, other indicators and information from liaison continued to suggest that hiring intentions outside mining-related activities remained relatively subdued.

The above chart shows Australia's overall unemployment rate, which is solid by comparison to literally everybody else. However, note again that the Australian economy is a bit of a "one trick pony;" mining/natural resources are booming and everybody else is limping.
Recent data indicated that private wage growth had been relatively steady in the past few quarters. The wage price index for the private sector increased by 0.9 per cent in the March quarter, to be 3.7 per cent higher over the year; growth of public-sector wages slowed a little in the quarter and was running at 3.1 per cent in year-ended terms. In line with differences in labour market conditions across the country, the pace of private-sector wage growth had picked up across a broad range of industries in Western Australia, although, relative to other states, the difference in the rate of growth of wages was less marked than it had been in 2007–2008. Fair Work Australia's annual wage review announced a 2.9 per cent increase in the minimum wage and award wages.
The above wage gains are impressive, and are probably largely caused by the economy being near full employment. The only way for a company to attract workers in the current environment is through increasing wages.
Overall, things are OK, but not great. Most importantly, the one-sided nature of their economy is a big problem right now, as a consensus is emerging that China is now looking to shift their economy from one driven by manufacturing and trade to one driven by internal demand.
The good thing about Australia is their Central Bank Board, which recently lowered rates in response to the declining situation. As noted by the Money Illuision Blog:
Forget about the implied 5.5% NGDP growth forecast. Australia has a 2-3% inflation target and faster trend RGDP growth than the US. That sort of nominal growth would be beyond my wildest dreams for the US. Rather think about how proactive they are. Unemployment is low and inflation is in the sweet spot. But they are easing monetary policy because they see the global slowdown, which for some reason the much more sophisticated Fed and ECB don’t quite comprehend. They aren’t cutting rates because 5.5% NGDP growth is too low, they are cutting rates to make sure that 5.5% NGDP growth happens.
The Fed seems content to wait until our recovery is off the rails, and then pull out still another QE, each one less stimulative than the last, because they mostly work via signalling. Every time the Fed fails to carry through it losses a little more credibility. And the biggest irony is that the credibility loss they are worried about is too much inflation! That’d be like Mitt Romney worrying that people will regard him as too spontaneous and reckless.
Some Basic Health Care Facts
Tomorrow we should hear from the Supreme Court regarding health care. Health care is by far the largest part of the US economy, totaling about 15%. It's the only segment of the economy to continually add jobs over the last few years, largely because of the aging US population. And the system to paying for that is beyond broken.
The individual mandate that is causing all the hoopla was first proposed by the Heritage Foundation in 1989. It was also part of the Republicans response to the Clinton health initiative in 1994. Finally, the original bill for health reform had strong bi-partisan support. Put another way, it was included as part of the bill because it was thought (rationally) that because they proposed it, they'd support it. Either they were incredibly stupid regarding its constitutionality, or they, too thought it was constitutional for most of that time. And in case you're wondering, most constitutional professors think its constitutional.
Over the last few days, Wonkblog at the Washington Post (and Ezra Klein in particular) has done a great job of highlighting some of the issues involved and explaining how we got here. First, here are some basic facts about the bill as it currently stands:
It's complicated law because it's a complicated area of the economy that is really quirky. There is no simple way to solve this. That's why it was 2700 pages when passes.
The individual mandate that is causing all the hoopla was first proposed by the Heritage Foundation in 1989. It was also part of the Republicans response to the Clinton health initiative in 1994. Finally, the original bill for health reform had strong bi-partisan support. Put another way, it was included as part of the bill because it was thought (rationally) that because they proposed it, they'd support it. Either they were incredibly stupid regarding its constitutionality, or they, too thought it was constitutional for most of that time. And in case you're wondering, most constitutional professors think its constitutional.
Over the last few days, Wonkblog at the Washington Post (and Ezra Klein in particular) has done a great job of highlighting some of the issues involved and explaining how we got here. First, here are some basic facts about the bill as it currently stands:
By 2022, the Congressional Budget Office estimates (pdf) the Affordable Care Act will have extended coverage to 33 million Americans who would otherwise be uninsured.
2. Families making less than 133 percent of the poverty line — that’s about $29,000 for a family of four — will be covered through Medicaid. Between 133 percent and 400 percent of the poverty line — $88,000 for a family of four – families will get tax credits on a sliding scale to help pay for private insurance.
3. For families making less than 400 percent of the poverty line, premiums are capped. So, between 150% and 200% of the poverty line, for instance, families won’t have to pay more than 6.3 percent of their income in premiums. Between 300 percent and 400 percent, they won’t have to pay more than 9.5 percent. This calculator from the Kaiser Family Foundation will let you see the subsidies and the caps for different families at different income levels.
4. When the individual mandate is fully phased-in, those who can afford coverage — which is defined as insurance costing less than 8 percent of their annual income — but choose to forgo it will have to pay either $695 or 2.5 percent of the annual income, whichever is greater.
5. Small businesses that have fewer than 10 employees, average wages beneath $25,000, and that provide insurance for their workers will get a 50 percent tax credit on their contribution. The tax credit reaches up to small businesses with up to 50 employees and average wages of $50,000, though it gets smaller as the business get bigger and richer. The credit lasts for two years, though many think Congress will be pressured to extend it, which would raise the long-term cost of the legislation.
6. Insurance companies are not allowed to discriminated based on preexisting conditions. They are allowed to discriminate based “on age (limited to 3 to 1 ratio), premium rating area, family composition, and tobacco use (limited to 1.5. to 1 ratio).”
7. Starting in 2018, the law imposes a 35 percent tax on employer-provided health plans that exceed $10,200 for individual coverage and $27,500 for family coverage. The idea is a kind of roundabout second-best to capping the tax code’s (currently unlimited) deduction for employer-provided heath insurance. The policy idea is to give employers that much more reason to avoid expensive insurance policies and thus give insurers that much more reason to hold costs down.
8. The law requires insurers to spend between 80 and 85 percent of every premium dollar on medical care (as opposed to administration, advertising, etc). If insurers exceed this threshold, they have to rebate the excess to their customers. This policy is already in effect, and insurers are expected to rebate $1.1 billion this year.
9. The law is expected to spend a bit over $1 trillion in the next 10 years. The law’s spending cuts — many of which fall on Medicare — and tax increases are expected to either save or raise a bit more than that, which is why the Congressional Budget Office estimates that it will slightly reduce the deficit. (There’s been some confusion on this point lately, but no, the CBO has not changed its mind about this.) As time goes on, the savings are projected to grow more quickly than the spending, and CBO expects that the law will cut the deficit by around a trillion dollars in its second decade.
10. In recent years, health-care costs have slowed dramatically. Much of this is likely due to the recession. Some of it may just be chance. But there’s also evidence that the law has accelerated changes in the way the medical system delivers care, as providers prepare for the law’s efforts to move from fee-for-service to quality-based payments.
11. The law’s long-term success at controlling costs will likely hinge on its efforts to change the way health care is delivered, most of which have gotten very little attention. They include everything from encouraging Accountable Care Organizations to spreading medical homes to penalizing hospitals with high rates of preventable infections to creating an independent board able to quickly implement new reforms through the Medicare system.
It's complicated law because it's a complicated area of the economy that is really quirky. There is no simple way to solve this. That's why it was 2700 pages when passes.
Housing and Second Half Growth
- by New Deal democrat
Although the economy has obviously slowed down in the last 3 months, and I expect the data to continue to look near-recessionary for about a couple of months more, I continue to believe we will have a rebound in the second half of this year.
The biggest reason for expecting a positive jolt to the economy comes from the least expected source: housing. An increase or decrease in the number of houses built has been one of the surest harbingers of where the economy as a whole is headed 12 to 18 months later.
The below graph is an update of one I published a few months ago. It contrasts YoY GDP% growth (red) with the increase or decrease in the number of houses built YoY (blue). Generally speaking, for each increase of 100,000 in houses built YoY, there is a 1% increase in GDP growth YoY over trend:
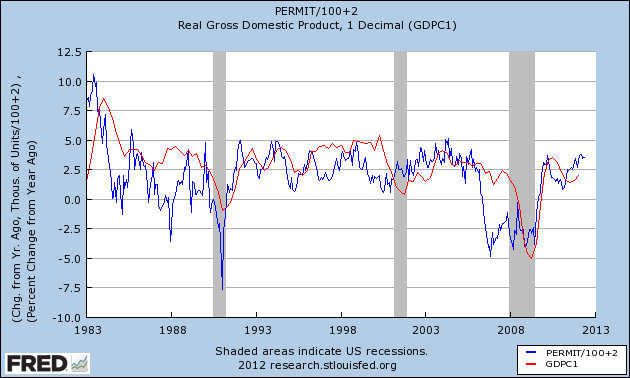
This year we have generally built about 200,000 houses more than last year. That suggests that by the end of this year or early next year we should be seeing 3%+ YoY GDP growth. Of course GDP is an imperfect measure, but the fact remains that the higher the GDP, the more job growth, and that plus income growth for the average American is what I care about.
____________
From Bonddad: I want to add a few points.
1.) Housing has been a stealth story, hidden by all the problems in the EU and the BRIC slowdown. However, we've seen better and better numbers from the housing market. Granted, these are coming from the lowest level in decades, so saying there's an increase isn't saying too much. However, consider the following chart:

The housing affordability index is near an all-time high. Here is how the index works:
Value of 100 means that a family with the median income has exactly enough income to qualify for a mortgage on a median-priced home. An index above 100 signifies that family earning the median income has more than enough income to qualify for a mortgage loan on a median-priced home, assuming a 20 percent down payment. For example, a composite housing affordability index (COMPHAI) of 120.0 means a family earning the median family income has 120% of the income necessary to qualify for a conventional loan covering 80 percent of a median-priced existing single-family home. An increase in the COMPHAI then shows that this family is more able to afford the median priced home.Finally, remember that building permits are a leading indicator while total payrolls is a coincident indicator. Put another way, builders have to start building in anticipation of demand, largely because it takes awhile to get a housing community up and running.
As I've previously stated, I think part of the reason for the increase in real estate activity over the last say 6 months is simply that the market swung hard to the "not doing anything"side, which was in contrast to the "let's make housing the centerpiece of the US economy" stance of the early 2000s. However, we're starting to see a fair amount of activity in this part of the economy. It's fragile, but it is definitely there.
Morning Market Analysis; Asia Treading Water

The weekly chart of the Chinese market shows that -- although prices are now below the 200 day EMA -- they have steadied above the 32 price level for the last month. However, the EMAs are acting as technical resistance, momentum is dropping, money is flowing out of the market and volatility is up. The key here is for prices to hold the 32 price level. Should they break that level, the next logical price target is 31 and then 30.

The Japanese market hit a two and a half year low at the end of May and have since rallied, hitting resistance at the 10 week EMA. Like the Chinese market, the underlying technicals are weak: momentum is declining and the CMF is negative, while volatility is increasing.

Hong Kong is a bit stronger. Prices did break an uptrend started in the third quarter of law year, but prices remain above the 200 week EMA. Momentum is slightly negative, as is the CMF.

Taiwan's market is in similar shape to Hong Kong's, although prices are below the 200 day EMA rather than above it.

Singapore's market is also just above the 200 day EMA. However, it has hit resistance at the 10 week EMA.
The good news in the above charts is that prices have stabilized over the last month or so. In addition, two of the markets are still above their 200 week EMA. However, the elephant in the room is China, which is still below its 200 week EMA and has several weak technical developments.
Tuesday, June 26, 2012
Bonddad Linkfest
- GOP clash looms over tax bill (The Hill)
- How Republicans made it possible to vote against the mandate (WaPo)
- Chicago Fed national activity index declines (Chicago Fed)
- New home sales increase in May (CR)
- China's LEIs increase (Conference Board)
- Weather casts doubt on crop forecasts (FT)
- Money raised on equity markets at a 7 year low (FT)
- Cyprus requests a bailout (FT)
How Low Will Oil Fall?

The daily chart is very bearish. Let's start with the price section and move outward.
1.) Prices have been dropping for two months. We see a gradual, continual sell-off in May, followed by a price consolidation in June. Prices traded between 82.5 and 85 for the first few weeks of the month, but have moved a touch lower since. Prices are using the EMAs as technical resistance.
2.) The MACD declined in May and moved sideways in June. Although ti gave a buy signal earlier this month, the MACD is still in negative territory and the angle of the rise is not encouraging.
3.) Overall, prices are still very weak versus the short-term trend.
4.) For the last 6 weeks, money has been flowing out of the market. Also note the fairly negative readings at the beginning of the month; traders were selling at the fastest clip in the last 6 months.
5.) The good news is the volatility is decreasing, indicating the sell-off might be nearing the end.

Above is a weekly oil chart. Let's take a look at the technicals, starting with the price section.
1.) Prices have been dropping since the first week of May -- a nearly two month stretch. We see prices traded sideways for two weeks after falling below the 200 day EMA, but they could not get any momentum going. They fell further last week. Right now, we see technical support at the 75 price level.
2.) Prices are below the 200 week EMA. Also note the shorter EMAs are moving lower. These two developments are bearish.
3.) The MACD is negative and declining.
4.) The RSI is very low -- it's right around 30. While some traders use this as a signal for a reversal, I don't. Instead, I simply use the RSI as a gauge of where prices are relative to recent price action. This reading tells us that prices are weaker today than the 14 day average.
4.) The CMF is right around 0. While we've seen some negative readings, they haven't been that severe.
5.) Volatility is up.
Overall, these two charts are bearish. Any rally would be seen as a technical trade rather than a big move higher. I'd be looking at 75 as a price target based on the above.
Why Would A Bad Situation in Europe Hurt the US?
Something that we really haven't touched on is why does the EU situation hurt the US? After all -- they're over there, and we're over here. Doesn't the Atlantic provide any kind of buffer for the situation?
No. Here's why:
1.) One of the primary reasons for the formation of the EU was to create a common market for the European continent. That is now the second largest economic region in the world, trailing only the US in terms of size. And that block has now been in existence for the last 10+ years, meaning it has become part of the world-wide trading system. Speaking from personal experience, when a company is looking to expand, we try to get them "into the EU," as opposed to "getting them into France." Now that system is in danger of splitting up, meaning that a coherent economic region may now become fragmented. That creates enormous uncertainty for businesses -- it essentially freezes most moves into that region until the situation is resolved.
2.) The inter-relationship of financial markets is now at an all time high. When the German market falls, it creates a negative loop that feeds into the Asian markets and then the US. When EU investors seek safety, they buy US treasury bonds across the ocean. In short, money doesn't stay locked in the EU, especially when other, safer alternatives exist. And that easy, cross-border flow of money ties the two economies together like never before. Also remember that financial markets are leading indicators of economic activity. The stock market and yield spread are both parts of the Conference Board's leading indicator index.
3.) All banks have portfolios of bonds. Some of the larger banks own bonds issued by some of the countries that are weakening -- Spain, Greece, Portugal, and Italy. Should these countries leave the EU, their bond prices will drop, which will in turn force the banks to take losses on their bond holdings. This, in turn, makes it more difficult for banks to make loans, thereby slowing the recovery here.
4.) Overall sentiment and psychology. While difficult to define and quantify, it's hard to ignore the overall negative impact on sentiment when we continually hear negative news from a significant part of the world. Put another way, when was the last time you heard about good news coming from Europe? It's been quite awhile. Eventually, that starts to have an impact on your actions and decisions. Magnify that several times over, and you'll start to see the ripple effect as it moves through the economy.
Case Shiller index shows more evidence housing prices have bottomed
- by New Deal democrat
This morning's Case Shiller report of repeat home sales is more evidence that housing prices have already bottomed. Unlike most commentary, which inexplicably focuses on the non-seasonally adjusted index, I focus on the seasonally adjusted data. So long as those adjustments are fair, the month over month seasonally adjusted index is going to show changes in trend well before the year-over-year measures turn.
For April (really an average of February, March, and April), the seasonally adjusted 20 city index rose for the third month in a row. As the below graph shows, outside of the time period when the $8000 housing credit was in effect, this is the first time we have had house price increases for three months in a row since the peak of the market in 2006. (Note: graph does not include this morning's increase):
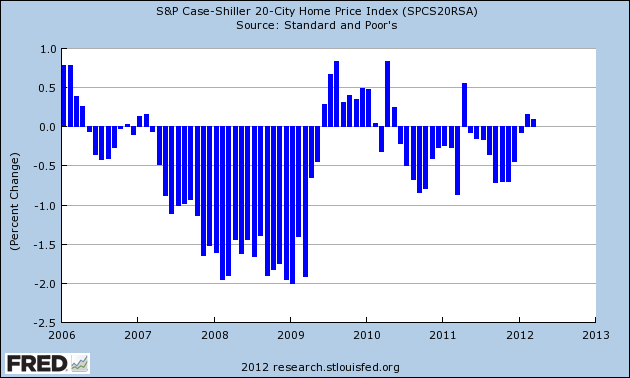
Beyond the aggregate number, the diffusion of the gains was also impressive. Sixteen of 20 metropolitan areas in the index showed seasonally adjusted month over month gains - meaning the gains were not simply a factor of house prices typically going up in the spring, and were widespread.
On a YoY basis, the index declined only -1.9%.
A year ago, I said that I expected Housing Tracker's index of asking prices to turn positive YoY by early this year. It did, at the end of November of last year. I also said I expected it to lead the Case Shiller index. It did that too. The only caveat I have now, as I had a year ago, is that the turn has been in nominal prices, rather than real, inflation-adjusted prices, which may still be a long way off. At this point the only argument the housing bears have left is waiting for the long-fabled foreclosure tsunami to finally wash ashore.
This morning's Case Shiller report of repeat home sales is more evidence that housing prices have already bottomed. Unlike most commentary, which inexplicably focuses on the non-seasonally adjusted index, I focus on the seasonally adjusted data. So long as those adjustments are fair, the month over month seasonally adjusted index is going to show changes in trend well before the year-over-year measures turn.
For April (really an average of February, March, and April), the seasonally adjusted 20 city index rose for the third month in a row. As the below graph shows, outside of the time period when the $8000 housing credit was in effect, this is the first time we have had house price increases for three months in a row since the peak of the market in 2006. (Note: graph does not include this morning's increase):
Beyond the aggregate number, the diffusion of the gains was also impressive. Sixteen of 20 metropolitan areas in the index showed seasonally adjusted month over month gains - meaning the gains were not simply a factor of house prices typically going up in the spring, and were widespread.
On a YoY basis, the index declined only -1.9%.
A year ago, I said that I expected Housing Tracker's index of asking prices to turn positive YoY by early this year. It did, at the end of November of last year. I also said I expected it to lead the Case Shiller index. It did that too. The only caveat I have now, as I had a year ago, is that the turn has been in nominal prices, rather than real, inflation-adjusted prices, which may still be a long way off. At this point the only argument the housing bears have left is waiting for the long-fabled foreclosure tsunami to finally wash ashore.
Morning Market Analysis

The five minute chart shows the overall price action for the markets yesterday. Prices gapped lower at the open and moved lower all morning. However, prices found their bottom around noon and then traded sideways for the remainder of the day. Notice there were two small rally attempts -- one about 1:300 and one a little after 3:00. Both failed.


The 60 minute charts shows that prices are now back into areas with strong price support. For the IWMs (top chart), that's in the 75.5-77 area, for the QQQs (middle chart) that's 62-63, and for the SPYs (the bottom chart) that's 131-133. Also note there is support for all three charts at levels established in early June.


The entire US treasury curve -- from the short end (top chart) to the long end (bottom chart) -- is still trading at high levels. Also note there is no indication of any sell-off coming down the pike; all the charts are bullish, with the exception of the SHYs (but, how much more can they rally in a 0% environment).
Monday, June 25, 2012
Bonddad Linkfest
- Transportation bill again up for extension (CNN)
- The source of the global economic stalemate (WaPo)
- How policy has contributed to the great divide (WaPo)
- 11 facts about the ACA (Wonk Blog)
- Legal scholars think mandate valid (BB)
- Everything you need to know about the SC and ACA (Wonk Blog)
- Developing economies currencies taking a big hit (BB)
What Krugman Said
It's taken me a very long time to get my head around the idea of the "liquidity trap" -- and frankly, I'm not sure I still get the idea completely. However, this is a very lucid explanation of what's involved from Krugman:
This is one of the reasons I harp on the lower levels levels of monetary velocity right now; that tells us people simply are not spending nearly as fast as they should. As a result, money is being "saved" -- or perhaps more appropriately, not spent. As a result, there is an excess of funds to lend. But, there is not enough investment to soak up the increased savings. In theory, this would be accomplished by lower interest rates -- which, unfortunately, can't go lower than 0%. This means there's essentially a market failure in the money market -- interest rates can't move lower. Hence, we see a primary reason for the low interest rates on government debt; we have an excess of savings sopping them up. This also tells us that government bonds aren't competing with corporates for financing.
Now, if people are borrowing, other people must be lending. What induced the necessary lending? Higher real interest rates, which encouraged “patient” economic agents to spend less than their incomes while the impatient spent more.
OK, so that’s what happens when an economy is engaged in increased leveraging. Then something makes people remember the dangers of debt, and leveraging gives way to deleveraging.
You might think that the process would be symmetric: debtors pay down their debt, while creditors are correspondingly induced to spend more by low real interest rates. And it would be symmetric if the shock were small enough. In fact, however, the deleveraging shock has been so large that we’re hard up against the zero lower bound; interest rates can’t go low enough. And so we have a persistent excess of desired saving over desired investment, which is to say persistently inadequate demand, which is to say a depression.
By the way, this is in a fundamental sense a market failure: there is a price mechanism, the real interest rate, that because of the zero lower bound can’t do its job under certain circumstances, namely the circumstances we face now.
What to do? One answer is fiscal policy: let governments temporarily run big enough deficits to maintain more or less full employment, while the private sector repairs its balance sheets. The other answer is unconventional monetary policy to get around the problem of the zero lower bound: maybe unconventional asset purchases, but the obvious answer is to try to create expected inflation, so as to reduce real rates.
Now look at what the serious people say: we must have fiscal austerity, not stimulus, because debt is bad; we must not have unconventional monetary policy, because that would endanger “credibility” (where it’s not at all clear what that means).
So basically, we must do nothing to fix this horrific market failure, and allow unemployment to fester instead.
It’s really awesome, when you think about — not just that we’re committing this massive act of folly, but that it’s all being done in the name of sound policy.
This is one of the reasons I harp on the lower levels levels of monetary velocity right now; that tells us people simply are not spending nearly as fast as they should. As a result, money is being "saved" -- or perhaps more appropriately, not spent. As a result, there is an excess of funds to lend. But, there is not enough investment to soak up the increased savings. In theory, this would be accomplished by lower interest rates -- which, unfortunately, can't go lower than 0%. This means there's essentially a market failure in the money market -- interest rates can't move lower. Hence, we see a primary reason for the low interest rates on government debt; we have an excess of savings sopping them up. This also tells us that government bonds aren't competing with corporates for financing.
Another Week of Negative News
Once again, we had a week where the overall economic news was, at best, bad.
Consider the following:
Australian Leading Index declines:
EU Markit Manufacturing index shows contraction:
Simply put, there is nothing good coming out in the economic numbers right now.
Consider the following:
Australian Leading Index declines:
The Conference Board LEI for Australia fell sharply in April led by a large decline in building approvals (April’s significant drop in the housing indicator was mainly due to a temporary interruption in approval processing), and there were downward revisions to the past few months as actual data for sales to inventories ratio* and gross operating surplus* for the first quarter of 2012 became available. With this month’s decline, the six-month change in the leading economic index remained negative at 2.8 percent (about a -5.5 percent annual rate) between October 2011 and April 2012, significantly down from the increase of 1.0 percent (about a 1.9 percent annual rate) during the previous six months. In addition, the weaknesses among the leading indicators have been somewhat more widespread than the strengths in recent months.The overall trend for this number is now down. As my co-blogger Silver Oz points out, this may be a country specific event; Australia is heavily dependent on China, which is itself slowing down. In addition, Australia is also heavily dependent on natural resources, which are also declining.
EU Markit Manufacturing index shows contraction:
The Markit Eurozone PMI® Composite Output Index was unchanged at 46.0 in June, according to the preliminary ‘flash’ reading which is based on around 85% of usual monthly replies. The index therefore signalled that the private sector economy shrank at a rate unchanged on May – which had seen the steepest contraction since June 2009.Philly Fed Manufacturing Index tanks
With the exception of a marginal increase in January, the survey has recorded continual contraction since last September, with the rate of decline having gathered significant momentum in the second quarter. The second quarter has seen the steepest downturn for three years
Manufacturing firms responding to the Business Outlook Survey indicated weaker business conditions this month. The survey’s diffusion index of current activity fell to -16.6 from a reading of -5.8 in May, its second consecutive negative reading. The survey’s indicators of future activity remained positive and improved slightly.China's manufacturing index dropped into negative territory:
Indicators for new orders, shipments, and average work hours were also negative this month, suggesting overall declines in business. Indexes for current unfilled orders and delivery times both registered negative readings again this month, suggesting lower levels of unfilled orders and faster deliveries
China’s manufacturing may shrink for an eighth month in June, matching the streak during the global financial crisis in a signal the government’s stimulus has yet to reverse the economy’s slowdown.German sentiment is decreasing:
The preliminary reading was 48.1 for a purchasing managers’ index today from HSBC Holdings Plc and Markit Economics. Above-50 readings indicate expansion. The lowest crisis level was 40.9 in November 2008, when industrial production increased 5.4 percent from a year earlier, compared with a gain of 9.6 percent last month.
.....
If confirmed on July 2, the gauge would be at the lowest since November 2011 and equal the run of below-50 readings from August 2008 to March 2009.
The Ifo Business Climate Index for industry and trade in Germany continued to fall in June. Although assessments of the current business situation brightened somewhat after deteriorating significantly last month, companies reported far lower expectations with regard to their six-month business outlook.
The German economy fears the growing impact of the euro crisis. The business climate index in manufacturing dropped further. Manufacturers assess the current
business situation as slightly improved. As far as their six-month business outlook is concerned, however, manufacturers expressed far greater caution than in the past. Their expectations in terms of export business are also much lower and their recruitment plans remain defensive. In retailing the business climate recovered somewhat, after clouding over considerably last month. The retailers surveyed assess their current business situation much more positively and
are also no longer as pessimistic about future business developments as they were last month.
In wholesaling, on the other hand, the business climate indicator fell. Fewer wholesalers described their current business situation as good. Moreover, they are now slightly more sceptical as far as their outlook is concerned.
Simply put, there is nothing good coming out in the economic numbers right now.
Morning Market Analysis
Let's start with a look at the macro environment. Stocks are selling off. Developing markets are in bear markets. Commodities are dropping, but treasuries are rallying. This is the classic look of a slowing economy. Traders are selling stocks because of the degradation in the overall macro environment. They're selling commodities for the same reason. Treasuries are rallying on the safe haven bid. The only good news here is that the yield curve has not inverted. But, this might not be a good sign -- or, more precisely, this may not be a possibility right now. In a 0% rate environment, the Fed can't drop interest rates to stimulate demand, so there is no reason to start buying treasuries on the assumption that you're getting the best safe yield for the foreseeable future.

The monthly SPY chart shows that prices are still in the rally started in the beginning of 2009. The volume indicators are positive, and relative strength is fair. The overall EMA picture is fair; the shorter EMAs are above the longer and all are rising. Ideally, we'd like to see a somewhat sharper angle. However, the MACD is concerning, as is the fact that prices hit resistance at 2008 highs, only to move lower.

Note that the long end of the treasury curve is still in the middle of a multi-year rally. Most importantly, note the two recent rallies; the first at the end of the summer/beginning of the fall in 2011 and the recent move higher. Both of these occurred about two years into the expansion -- at a time when money should have been going into equities and commodities.

Oil hasn't hit the highs of 2008, but has hit two successive "mini-highs" over the last two years. These spikes occurred right before two periods of economic weakness. However, notice that over the last two months, oil prices have decreased. sending prices below the 10, 20 and 50 week EMA.
Sunday, June 24, 2012
What's you favorite summer drink?
- by New Deal democrat
Here's a question for a summer Sunday: what is your favorite summertime beverage, alcoholic or not?
Last summer I started working on concocting my perfect summer libation. I know I want lime, mint, vodka, and ice, but I don't want it overly sweet (so not a mojito), and I don't want a bitter aftertaste (so not a vodka and tonic). I've been experimenting so far with seltzer water, ginger ale, peppermint schnapps, and creme de menthe among other things, but still haven't found just the right combination.
Of course, all of this experimentation has required repeated and extensive testing!
So, what's your favorite liquid relaxation to beat the heat?
Subscribe to:
Posts (Atom)