Saturday, November 6, 2021

Weekly Indicators for October 1 - 5 at Seeking Alpha


 - by New Deal democrat

My Weekly Indicators post is up at Seeking Alpha.

As I point out from time to time, one of the biggest values in tracking data that is reported with high frequency, i.e., weekly as opposed to monthly or quarterly, is that you are able to spot changes in trends much more quickly.

Apropos of which, the surge in consumer spending + shipping bottlenecks had caused shipping and commodity prices to spike. In the past few weeks, the theme of these “Weekly Indicator” pieces has been evidence that the spike may be peaking. This week’s column continues that theme with more evidence.

As usual, clicking over and reading will bring you up to the virtual moment, and rewards me a little bit for my efforts.

Friday, November 5, 2021

October jobs report: a very strong report putting to rest questions about the strength of the expansion


 - by New Deal democrat

In the light of the last two month’s relatively “poor” jobs readings, an important question was what was going to happen with revisions. As we will see below, they really delivered! - big positive revisions to both of the last two months’ numbers. Additionally, I have been watching manufacturing hours and payrolls, to see if that white-hot sector was holding up in the face of supply bottlenecks. Also important are  whether there were continued gains in leisure and hospitality jobs, or whether Delta had caused those to stall. Both of these metrics also were very positive this month.

The 6 month average of monthly gains as of now is 665,000 - not bad at all! But we still have 4.2 million jobs to go to equal the number of employees in February 2020 just before the pandemic hit. If you are doing math, that’s about 7 more months at this rate.

Here’s my synopsis of the report:

HEADLINES:
  • 531,000 jobs added. Private sector jobs increased 604,000, but government (mainly education) shed -73,000 jobs, having a great deal to do with haywire seasonal adjustments this year, and specifically public education, which shed -65,000 jobs. The alternate, and more volatile measure in the household report indicated a gain of 142,000 jobs - a relatively poor number - which factors into the unemployment and underemployment rates below.
  • The total number of employed is still -4,204,000, or -2.8% below its pre-pandemic peak.  At this rate jobs have grown in the past 6 months (which have averaged 665,000 per month), it will take another 7 months for employment to completely recover.
  • U3 unemployment rate declined -0.2% to 4.6%, compared with the January 2020 low of 3.5%.
  • U6 underemployment rate declined -0.2% to 8.3%, compared with the January 2020 low of 6.9%.
  • Those not in the labor force at all, but who want a job now, rose 9,000 to 5.978 million, compared with 5.010 million in February 2020.
  • Those on temporary layoff decreased 68,000 to 1,056,000.
  • Permanent job losers declined -125,000 to 2,126,000.
  • August was revised upward by 117,000, while August was revised upward by 118,000, for a net gain of 235,000 jobs compared with previous reports.
Leading employment indicators of a slowdown or recession

These are leading sectors for the economy overall, and will help us gauge how strong the rebound from the pandemic will be.  These were positive:
  • the average manufacturing workweek, one of the 10 components of the Index of Leading Indicators, declined -0.1 hour to 40.3 hours.
  • Manufacturing jobs increased 60,000. Since the beginning of the pandemic, manufacturing has still lost -270,000 jobs, or -2.1% of the total.
  • Construction jobs increased 44,000. Since the beginning of the pandemic, -150,000 construction jobs have been lost, or -2.5% of the total.
  • Residential construction jobs, which are even more leading, rose by 1,800. Since the beginning of the pandemic, 45,100 jobs have been *gained* in this sector, or +5.4%.
  • temporary jobs rose by 41,000 - a huge gain! Since the beginning of the pandemic, there have still been 173,300 jobs lost, or -5.9% of all temporary jobs.
  • the number of people unemployed for 5 weeks or less decreased by -152,000 to 2,085,000, which is now *lower* than just before the pandemic hit.
  • Professional and business employment increased by 100,000, which is still -215,000, or about -1.0%, below its pre-pandemic peak.

Wages of non-managerial workers
  • Average Hourly Earnings for Production and Nonsupervisory Personnel: rose $0.10 to $26.26, which is a 5.8% YoY gain. This continues to be excellent news, considering that a huge number of low-wage workers have finally been recalled to work. 

Aggregate hours and wages:
  • the index of aggregate hours worked for non-managerial workers rose by 0.3%, which is a  loss of -2.5% since just before the pandemic.
  •  the index of aggregate payrolls for non-managerial workers rose by 0.7%, which is a gain of 6.7% (before inflation) since just before the pandemic.

Other significant data:
  • Leisure and hospitality jobs, which were the most hard-hit during the pandemic, gained 164,000 jobs, but are still -1,383,000, or -8.2% below their pre-pandemic peak.
  • Within the leisure and hospitality sector, food and drink establishments gained 119,400 jobs, and is still -784,300, or -6.4% below their pre-pandemic peak.
  • Full time jobs increased 279,000 in the household report.
  • Part time jobs increased 159,000 in the household report.
  • The number of job holders who were part time for economic reasons declined by -45,000 to 4,423,000, which is an increase of 25,000 since before the pandemic began.

SUMMARY

With the exception of the “relatively” poor gain of 142,000 in the more volatile household report (still up an average of 477,000/month over the past 6 months), the decline in education jobs (almost certainly due to seasonality issues caused by the pandemic), and a slight decline in the manufacturing workweek, everything about this report was positive to strongly positive.

To begin with, the last two reports got revised significantly higher. In fact August is now 248,000 higher than when first reported. The average gain for the last 6 months remains over 600,000. All of the leading jobs sectors showed gains. Both full time and part time employment showed gains. Involuntary part-time employment is virtually back to where it was before the pandemic hit. Wages for non-managerial workers continued to increase sharply. Those on temporary layoff are down to 2015-16 levels. 

There is still substantial ground to be made up. As indicated above, we are still 4.2 million jobs below where we were in February 2020. At the current rate, it will take until next May to make up the remaining difference. Total hours worked are still -2.5% below their pre-pandemic peak, and there are still about 750,000 more permanent job losers than there were before the pandemic hit.

This was a very good report, putting to rest many questions about whether the recovery was faltering. 

Thursday, November 4, 2021

Three reasons for the decline in Biden’s (and Democrats’) popularity


 - by New Deal democrat

Dan Guild follows presidential approval closely, and uses it to model election outcomes, including State level as well as Congressional and Senate races. He’s been very consistent, and very good.


For the past several months, his hair has been on fire about a real decline in Biden’s approval ratings, for example, here. He is particularly concerned about the big decline among young adults, who all but boycotted Tuesday’s State level elections.

So, why has Biden’s approval rating declined? There are three very good reasons, two of which are related to economics.

Let’s start with his inability to get his major economic program, “Build Back Better,” through Congress. 

Here’s an excellent graph comparing the last 4 Presidents’ first year in office:


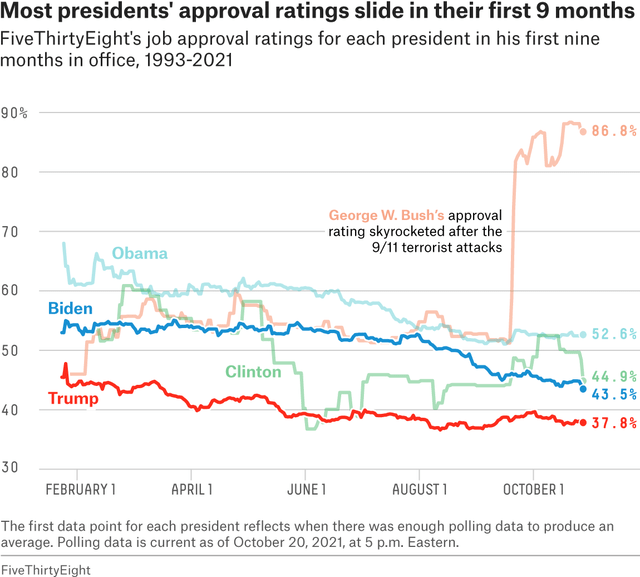
What is most noteworthy is that all 3 of the last Presidents have had similar trajectories, and for largely similar reasons. After initial success passing emergency stimulus, Obama’s Affordable Care Act was hopelessly mired in Congressional committees. Similarly, Trump was unable to “repeal and replace” Obamacare. 

When a President is completely stymied by Congress, their approval rating tanks.

Secondly, there’s the price of gas. Back in the George W. Bush Administration, there was a graph entitled “Presidential approval: it’s a gas, gas, gas” which persuasively showed that Bush’s approval rating closely correlated with the price of gas. Quite simply, people use the price of gas as an easy proxy for inflation (indeed, in my “Weekly Indicators” posts, the price of gas is a component of the “Miller Score” insofar as it helps measure the trade off between inflation and unemployment).

I recall that I occasionally noted that this heuristic continued in the Obama Presidency. His approval generally rose and fell with with price of gasoline as well.

So let’s update through the present. Below is the price of gasoline as a share of disposable personal income (blue) vs. consumer sentiment as measured by the University of Michigan (inverted, right scale, red):


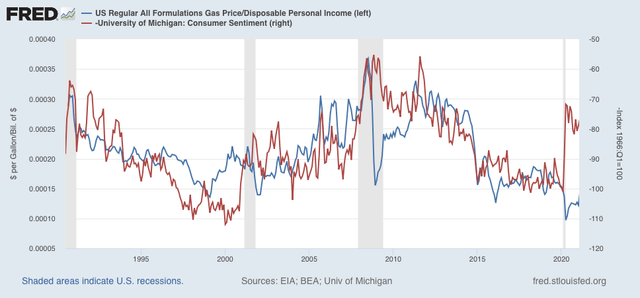
For the past 30 years, the two series track pretty well with the exception of periods right around recessions, where they tend to invert. That is to say, consumer sentiment generally falls as the price of gas rises, except when gas prices tank during recessions coincident with sentiment being at its worst.

Now here is the last two years, to focus on the pandemic:


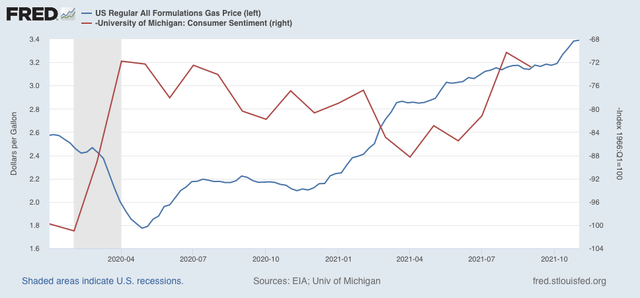
Beginning this past spring, gas prices and consumer confidence reverted to their normal configuration. The confidence numbers end with September, but October was actually a little worse, consistent with the continued rise in gas prices last month.

Consumers are noticing the pinch from gas prices, and it has influenced their opinions of Biden.

Finally, let’s turn to the one non-economic variable: the Delta wave.

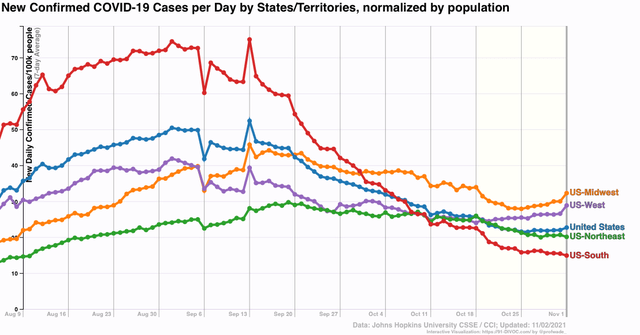
Here is the last 6 months of US coronavirus infections per capita:


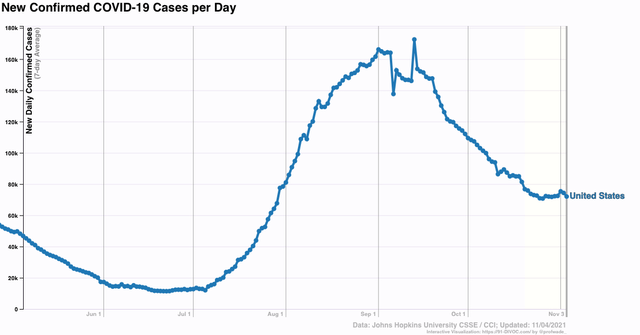
As you probably already recall, with vaccines the number of cases fell precipitously this past spring, to a low point of 11,300/day in late June. From that point until Labor Day, the Delta wave hit like a tsunami as case rose sharply to over 160,000/day. In the two months since, only half of that increase has been taken back by the Delta wave rolling out, as the US is still averaging over 70,000 cases/day.

I think the 3 above reasons are a succinct and accurate summary of the reasons for the decline in Biden’s popularity, and a reason why Election Day did not go so well for Democrats (in addition to the simple behavioral fact that anger is a much stronger motivator for voting than gratitude, a factor in all off-year elections). 

If inflation abates (likely), COVID cases decline (likely with increased vaccinations and more resistance due to higher numbers of previous infections), and Biden is able to get the Build Back Better reconciliation through Congress (?????), then Democrats are going to be - relatively speaking - in better shape for the 2022 midterms.

Layoffs, wages, and labor costs: three measures of the labor Boom


 - by New Deal democrat

Initial claims declined another 14,000 this week to 269,000, and the 4 week average declined 15,000 to 284,750, both new pandemic lows:


For the past 50 years, initial claims have only been at these levels briefly at the peak of the late 1990’s tech boom, and from 2015 to just before the pandemic in 2020.

Continuing claims also declined 134,000 to 2,105,000, also a new pandemic low:


This is very close to the cutoff line of 2,000,000 which has epitomized peak economic expansions in the past 50 years, as shown in the below graph which subtracts 2,000,000 from the reported numbers:


For all intents and purposes, nobody is getting laid off.

This tightness in the labor market means that workers are also commanding a bigger share of the fruits of their labor.  Unit labor costs (how much compensation has to be paid workers per unit of output) increased 2.0% in Q3 alone. This level of increase only occurred 7 times between the modern labor era dating to 1982 and the pandemic:


YoY unit labor costs are up 4.8%, which only occurred 4 times since 1982 before the pandemic:


While in the financial press unit labor costs are frequently bemoaned because they lessen potential profits to companies, since laborers have been largely cut out of productivity improvements since trade with China was opened in 1999, any return to a more equitable share is a good thing.

Finally, the employment cost index was reported for Q3 one week ago. I didn’t note it then, but it also showed labor costs increasing sharply, a new record at a 1.6% increase in one quarter alone:


The YoY increase of 4.6% was also a record:


What is noteworthy about the ECI is that it tracks compensation *normalized for the type of job,* i.e., it isn’t influenced by a different mix of high wage vs. low wage jobs. Dishwashers are compared with dishwashers, and so on.

The recovery from the pandemic has been the best time to be a worker since the late 1990s Boom.


Wednesday, November 3, 2021

October vehicle sales give sharply mixed message about the economy going forward


 - by New Deal democrat

Ok, FRED is back up and running, so here is my economic post of the day.


Vehicle sales used to be reported monthly by all manufacturers. Then, one by one, they switched to reporting only once a quarter, which makes their data much less interesting, since it is largely 90 days old by the time it is available. Not terribly helpful for looking ahead.

But the BEA also reports vehicle sales monthly, although for reasons unknown FRED does not post them until 4 weeks later.

Which is a too-lengthy introduction to saying that the BEA has reported October results, although the FRED graphs below only show through September.

In October both light vehicle and heavy duty truck sales were up vs. September, the former to 13.0 million units annualized, and the latter to 0.445 million units annualized. The below graph subtracts that amount from each so that it shows as zero (and truck sales are multiplied x30 for scale):


There have been significant declines in both car and truck sales this year. Light vehicle sales peaked at 18.3 million annualized in April, and truck sales at 0.515 million annualized in March.

The reading is mixed. In the past, heavy truck sales have been a much earlier and more reliable leading indicator for a recession. This year they have not declined by nearly so much as prior to other recessions. Meanwhile light vehicle sales, which are typically very noisy, have declined by much more than is usually the case before a recession.

We know that much of this decline is due to the inability of manufacturers to get all the parts they require. This in turn has driven up prices sharply, which has caused a decline in sales as well.

I read this as showing that there is little economic stress on the producer side of the economy (that purchases heavy trucks); but there will be ramifications on vehicle manufacturers that will ripple through the economy. Overall I do not read this as recessionary - at least not at this point. As with last month, this Friday’s jobs report should be watched for both the number of jobs and hours added or lost in the manufacturing sector.

About last night


 - by New Deal democrat

I was going to write about motor vehicle sales (not good), but FRED is down for maintenance. I might put something up later whenever the site comes back online. 

In the meantime, because a few people have asked me offline what I make of last nights results (at least in Virginia), so herewith is my take.

Virginia turned out about exactly how I expected. The RWers are as pi**ed as progressives were 2 and 4 years ago, so they were going to turn out more. And as soon as McAuliffe dissed parents’ right to have a say in the education of their children, I knew he was sunk, and would probably take down the rest of the ticket.

But here is the more extended discussion. There were a few main factors, uniquely local, overlaid with a typical off-year electoral trend.

There were two national factors:

1. People are motivated much more strongly to vote by anger over something that they feel has been taken away from them, than gratitude for something they feel has been given to them. This is basic human behavioral wiring. That’s why the out-party typically does well in off year elections. And courtesy of Fox and Facebook, RWers were thoroughly wound up. Which is why NJ is also so close. (Dems will have the same incandescent rage - regrettably - one year from now after the Supreme Court overrules Roe v. Wade.)

2. Manchin and Sinema have done some real damage to national Dems. Here Biden is, going on one year in office, and he still can’t get his main agenda out of Congress. This is similar to 2009-10 and Obamacare, when centrist Dems like Baucus and LIeberman slow-walked it nearly to death. It is also similar to what happened to the GOP four years ago, when Trump failed to get a repeal of Obamacare through the Congress. Trump had among his worst ratings ever right after McCain’s thumbs-down.

But there were several decisive factors unique to VA:

1. McAuliffe’s gaffe at the last debate saying parents shouldn’t have any control over their childrens’ education. Even if you think that statement is true, it was a disaster to say it. A million parents heard “F*** you, we’re going to control your children.” Up until that statement, all the polls showed McAuliffe ahead (despite the background national issues above, and including Afghanistan and whatever other extraneous event you want to include. McAuliffe was still winning). As soon as that statement got publicized, his polls all tanked, and continued that way.

2. McAuliffe ran Hillary’s 2016 anti-Trump campaign, and got Hillary’s 2016 result. This is in contrast to the last two off-year elections, where Democrats ran against the votes cast by GOP legislators in the Statehouse. And none of the candidates touted the good things Statewide Dems had done for people in the last 2 years.

In short, take away the gaffe, and run a campaign focused on the State, and VA Dems might have overcome the adverse national trends.

Tuesday, November 2, 2021

Coronavirus dashboard for November 2: the winter wave has begun


 - by New Deal democrat

The Delta decline is probably over. Nationwide US cases are up 4000/day from one week ago. The Northeast and South census regions still show a decline, but West and Midwest regions show increases: 


One week ago only 3 States were in the “increasing” category. Now the increasing trend States include: NJ, AL, CA, NV, AZ, CO, NM, ND, SD, MI, MN, IA, and NE. There are also slight increases in NY, RI, IN, and WI.

Some States still show declines: AK, VT, NH, PA, CT, WV, KY, DE, NC, SC, AR, FL, GA, MT, OK, TX, and WY.

The declines are almost all in the warmest States + those with the most recent outbreaks. The increases are with few exceptions in the colder States.

On the plus side, deaths are down 35% from the Delta peak into the middle of the “normal” range for this pandemic:


The winter wave has almost certainly begun.

But as of yesterday 80% of all US adults had at least one shot, and later this week we will probably cross the threshold of 70% of all US adults completely vaccinated. Including those age 12 and up the respective numbers are 78% and 68%. We can expect lots of younger school age children to have at least one shot before Thanksgiving, and be fully vaccinated by Christmas.

Plus, on average (with plenty of variation) being infected recently almost certainly conveys some resistance to reinfection - and in the past 4 months about 4% of all Americans had *confirmed* cases, most likely meaning that close to 10% were *actually* infected. 

Put that together, and there are significantly fewer people susceptible to infection at present than there were 4 or 12 months ago, so I strongly suspect this winter’s wave will not be as bad as either last winter’s, or Delta.

Monday, November 1, 2021

Manufacturing remained strong in October, while construction spending declined in September (but not yet at recessionary levels)


 - by New Deal democrat

As usual, we started out the month with the forward-looking ISM manufacturing report for October, as well as construction spending for September.


Let’s take the ISM report first, since it is an important short leading indicator for the production sector. Here the total index declined slightly - mere -03 - to 60.8, and the more leading new orders subindex declined sharply - by -6.9 to 59.8:


Since the break even point between increasing and decreasing numbers of respondents, both of October’s numbers in fact show strong expansion - in the case of new orders, simply not nearly so strong as in most of the last 12 months. In short, still quite positive.

Turning to construction, in nominal terms overall spending including all types of construction declined -0.5%, while spending on the leading residential sector declined  -0.4%, but still at levels very close to their all-time highs:


Adjusting for price changes in construction materials, which jumped by 0.7% in September, “real” construction spending declined -1.3%m/m, and “real” residential construction spending declined -1.1%. In absolute terms, “real” construction spending has declined sharply earlier this year, although there has been relative stabilization in the last few months:


“Real” total construction spending has now declined -18.7% since its post-recession peak in November 2020, while “real” residential construction spending has declined -14.8% since its post-recession peak in January of this year.

The above shows that, while total construction spending has declined by more than it had before the Great Recession, the decline in residential construction spending, while substantial, is nowhere near the big decline it suffered before the end of 2007 in this series that only dates from 2002.

This gives us essentially the same message that we got from single family housing permits several weeks ago: there has been a big decline in this long leading sector, but not yet what would typically precede a recession.