Saturday, January 19, 2008

Last Week's Market Action

Wow -- what a terrible week for the bulls:

The S&P 500 ended the week down 76, or 5.4%, to 1325, and has pulled back 15% since Oct. 9. The Nasdaq Composite Index gave up 100, or 4.1%, to 2340, and is 18% off its October high. The Russell 2000 Index of small stocks fell 31, or 4.5%, to 673. Its 21% drop since July 13 puts it officially in bear-market territory.


The bottom line is the market is dropping hard.

I'll have an article before the open on Monday about the markets. As a hint -- it will not be good.


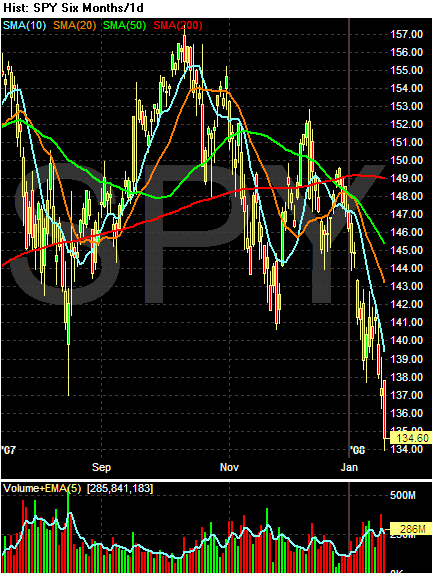
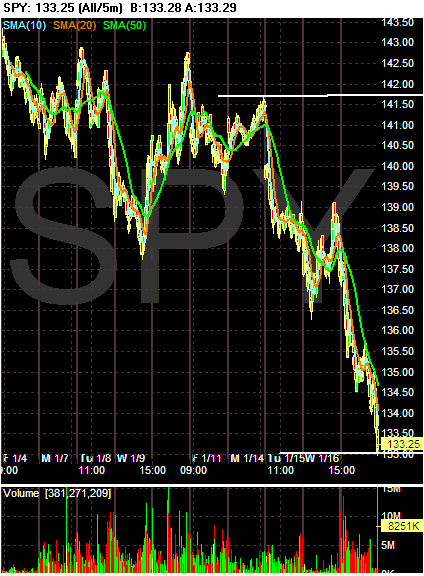
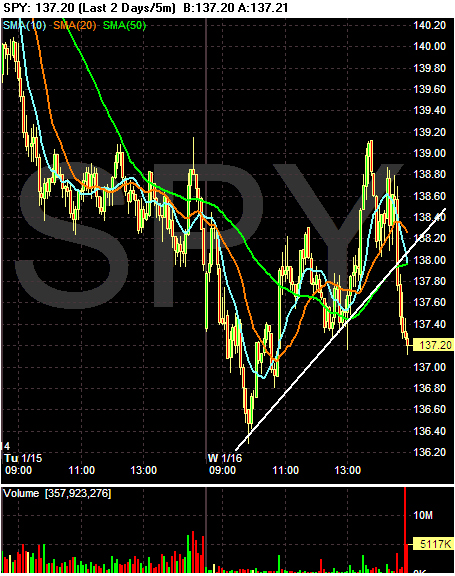
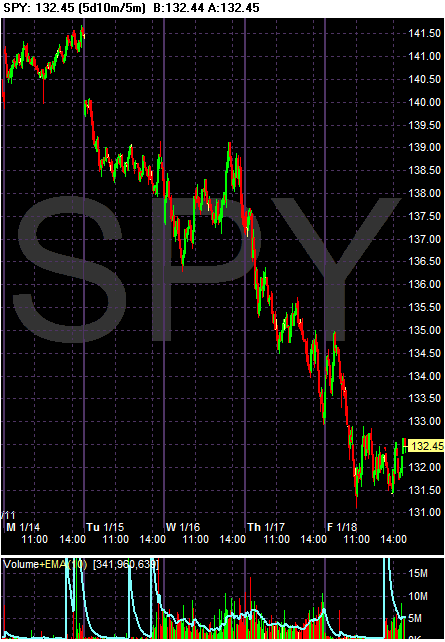
The SPYS have a pretty clear downward trajectory in place. Notice the following:

-- The index gapped down on Monday and never recovered

-- The market couldn't keep any gains. The market rallied near the end of trading on Tuesday but the rally faded. The same thing happened Wednesday and early Friday.

-- The chart has a clear pattern of lower lows and lower highs.


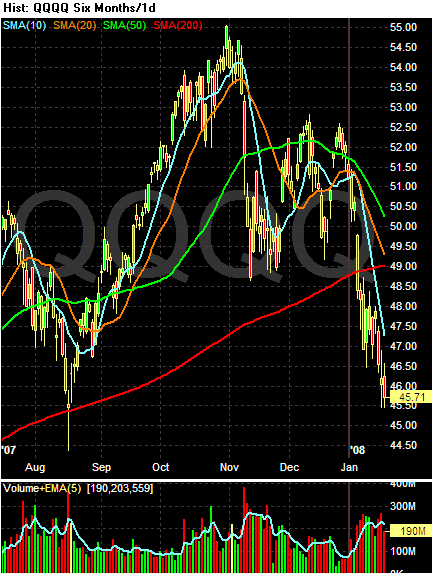
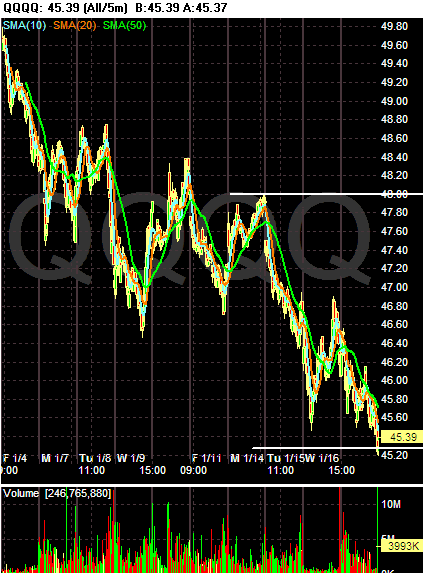
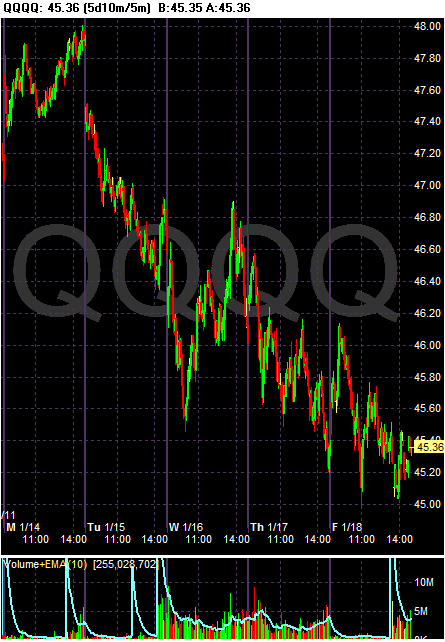
The QQQQs have a very clear downward trajectory. Notice the multiple times the index tried to rally but faltered. Also note the index ended the week near the weekly low. Bottom line: this chart is terrible.


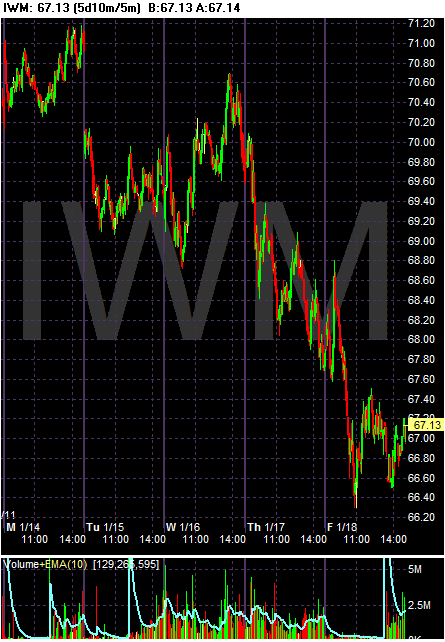
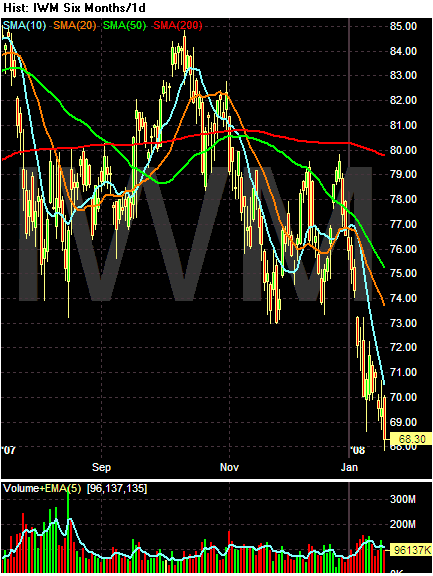
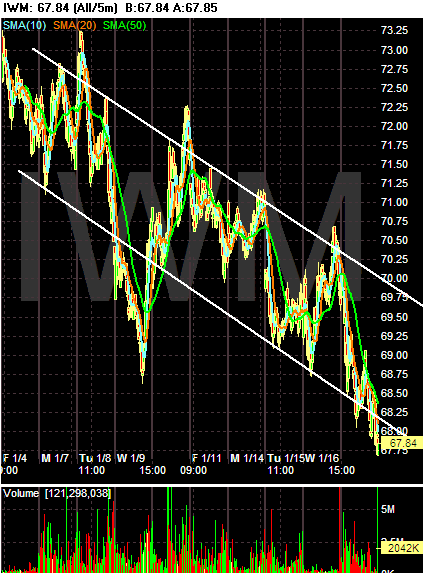
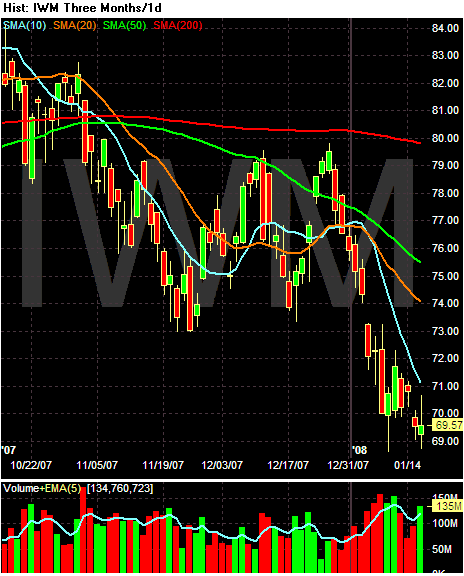
The IWMs are also in terrible technical shape.

-- They gapped lower at the open on Tuesday.

-- They tried to rally three times on Tuesday, but couldn't hold.

-- On Thursday there is a clear pattern of lower lows and lower highs.

-- The market dropped hard on Friday and closed near weekly lows.

There is nothing good in these charts; they all say the markets are in heavy sell mode.

Friday, January 18, 2008

Weekend Weimar and Beagle

The markets are closed (thank God). Take a break and forget about the markets and the economy for the rest of the day.

This is Kate in the "Weimar spot"


This is Sarge questioning my sanity


And this is Scooby at her pad

Retailers Cutting Back

From the WSJ:

The retail industry appears to be skidding toward its first big wreck in 17 years.

Chains are slamming the brakes on store openings, cutting back on inventory and girding for leaner times as consumer spending chills. The speed with which sales slowed during the holidays caught even cautious retailers off-guard, prompting a flurry of profit warnings.

.....

An expected 4% sales increase for the November-December holiday period at stores open at least a year rang in at only 3% compared with the 2006 holidays, according to trade group National Retail Federation -- the smallest increase since 2002. Even then, sales were propped up by inflation-boosted prices of food, fuel and drugs. Apparel, jewelry and home-products chains reported same-store sales declines.

It will be a discouraging first half of the year, economists warn. "It will feel like a recession to many people even if we technically avoid one," says Frank Badillo, senior economist at market researcher TNS Retail Forward. "Financial stress from high energy costs, the fallout from the housing slump and sluggish employment and income growth" will weigh on shoppers, projects Rosalind Wells, chief economist of the National Retail Federation.


This should surprise no one.

I'm traveling today. I'll probably write one or two more things as time permits

The WSJ Calls It: The Russell 2000 Is In a Bear Market

From the WSJ:

The Dow Jones Industrial Average plunged 306.95 points Thursday, down 2.5%, at 12159.21. All 30 of its components ended lower. The Russell 2000 was off 2.8%, or 19.34 points, at 680.57. The small-stock indicator, which includes many companies that rely heavily on a robust U.S. economy, is now off more than 20% from its July highs, the traditional threshold defining a bear market.

Thursday, January 17, 2008

Mr. Bernanke Goes to Washington

Yesterday, Bernanke made a presentation to Congress about the Fed’s outlook on the economy. Below are the major points (in italics and offset).

Since late last summer, financial markets in the United States and in a number of other industrialized countries have been under considerable strain. Heightened investor concerns about the credit quality of mortgages, especially subprime mortgages with adjustable interest rates, triggered the financial turmoil. Notably, as the rising rate of delinquencies of subprime mortgages threatened to impose losses on holders of even highly rated securities, investors were led to question the reliability of the credit ratings for a range of financial products, including structured credit products and various special-purpose vehicles. As investors lost confidence in their ability to value complex financial products, they became increasingly unwilling to hold such instruments. As a result, flows of credit through these vehicles have contracted significantly.


Let’s start with the charts (where else).


The SPYS have dropped from 156 – 134 – a drop of about 14%. And the chart is terrible: prices are moving lower, prices are below the 200 day SMA, the lower SMAs are below the longer SMAs etc…


The QQQQs have dropped from about 55 to 46, or a little more than 16%. That is not good.


And the Russell 2000 has dropped from about 84 to 68, or almost 19%.

No matter how you slice the market performance since their peaks, the overall performance is bad.

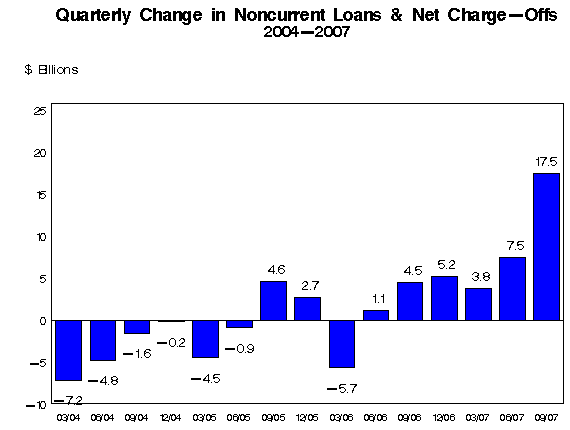
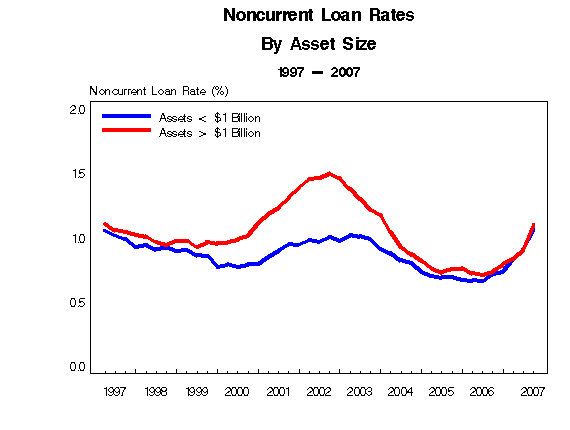
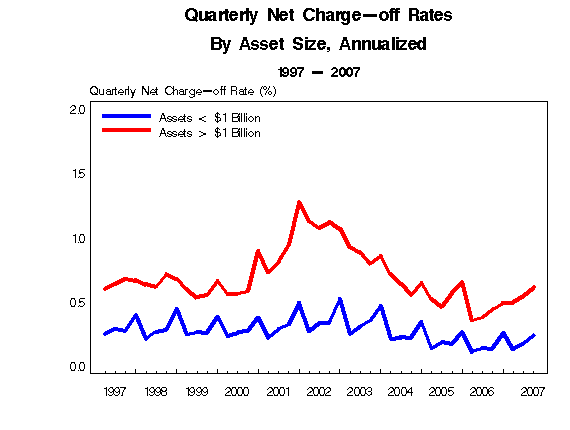
Here’s a graph from the latest FDIC quarterly survey (End of September 2007) of banking of loan charge-offs:


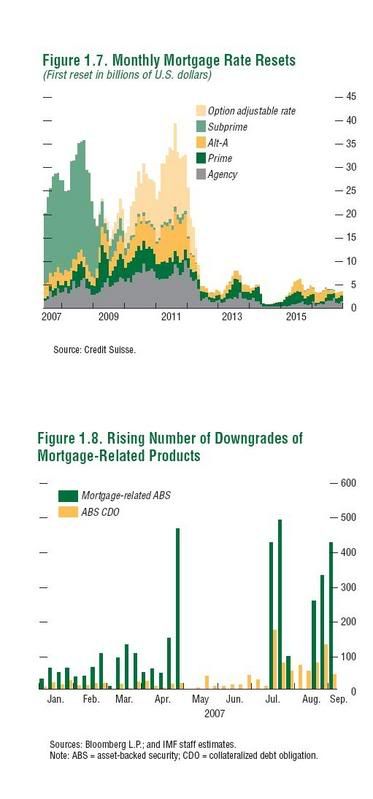
And here are two more pretty scary graphs from the same report:


And this was before this week's news -- which so far as stunk.

And we can expect another terrible year, given the number of problem mortgages in the system.


To date, the largest effects of the financial turmoil appear to have been on the housing market, which, as you know, has deteriorated significantly over the past two years or so. The virtual shutdown of the subprime mortgage market and a widening of spreads on jumbo mortgage loans have further reduced the demand for housing, while foreclosures are adding to the already-elevated inventory of unsold homes. New home sales and housing starts have both fallen by about half from their respective peaks. The number of homes in inventory has begun to edge down, but at the current sales pace the months' supply of new homes has continued to climb, and home prices are falling in many parts of the country. The slowing in residential construction, which subtracted about 1 percentage point from the growth rate of real gross domestic product in the third quarter of 2007, likely curtailed growth even more in the fourth quarter, and it may continue to be a drag on growth for a good part of this year as well.


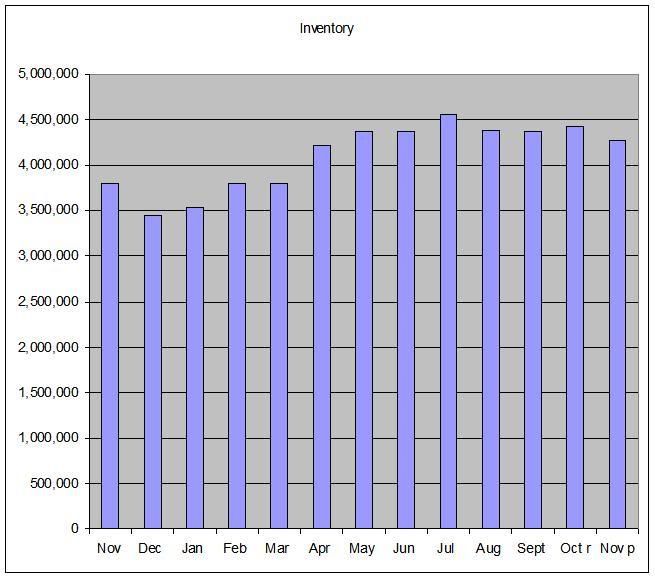
While the absolute amount of existing home inventory has stabilized:


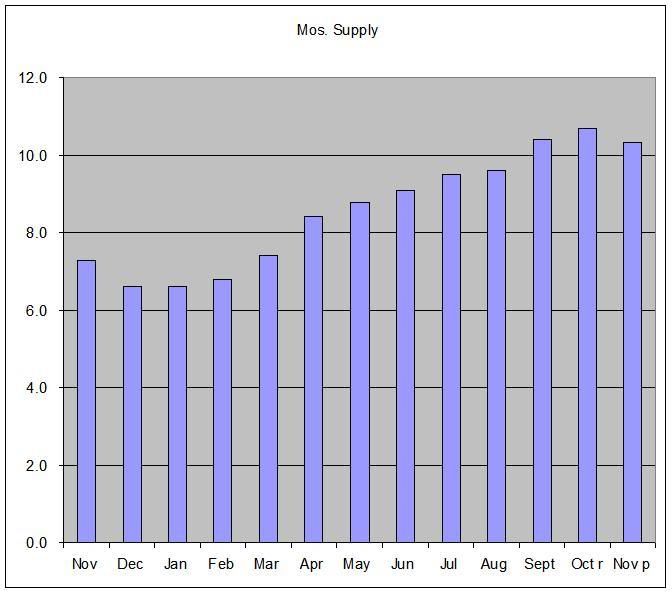
Months available for sale has continued to increase:


This indicates the rate of home sales is still dropping.

Recently, incoming information has suggested that the baseline outlook for real activity in 2008 has worsened and that the downside risks to growth have become more pronounced. In particular, a number of factors, including continuing increases in energy prices, lower equity prices, and softening home values, seem likely to weigh on consumer spending as we move into 2008. Consumer spending also depends importantly on the state of the labor market, as wages and salaries are the primary source of income for most households. Labor market conditions in December were disappointing; the unemployment rate increased 0.3 percentage point, to 5.0 percent from 4.7 percent in November, and private payroll employment declined. Employment in residential construction posted another substantial reduction, and employment in manufacturing and retail trade also decreased significantly. Employment in services continued to grow, but at a slower pace in December than in earlier months. It would be a mistake to read too much into one month's data. However, developments in the labor market will bear close attention


Energy prices are still high, although they have been coming down recently.

See the charts above for the stock market problems.


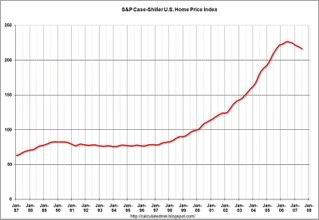
And home prices as measured by the Case Schiller index are starting to drop. Also note that home prices have increased considerable over the last 7 years. Assuming the home prices move back to the historical norm/mean (which prices usually do) the price correction could get really ugly.

The increase in the unemployment rate is very important; it took the wind out of a lot of bulls’ sails. Now bulls are pointing to the decline in unemployment insurance claims – especially the drop in the far more important 4-week average. However, I think that argument isn’t that strong considering how many other bullish indicators are dropping hard.

In the business sector, investment in equipment and software appears to have been sluggish in the fourth quarter, while nonresidential construction grew briskly. In light of the softening in economic activity and the adverse developments in credit markets, growth in both types of investment spending seems likely to slow in coming months. Outside the United States, however, economic activity in our major trading partners has continued to expand vigorously. U.S. exports will likely continue to grow at a healthy pace in coming quarters, providing some impetus to the domestic economy.


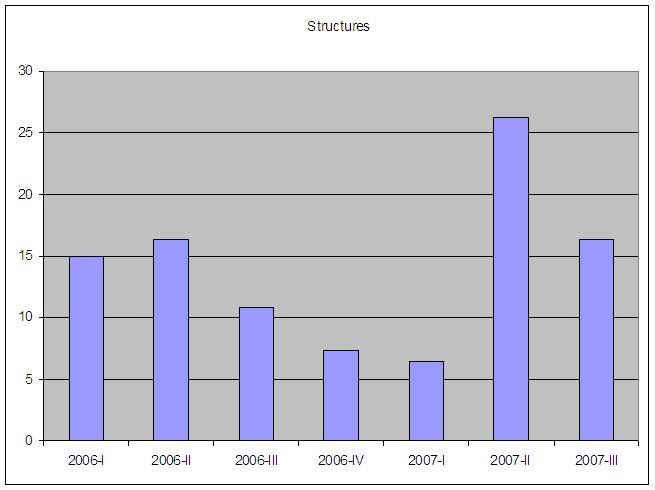
Above is a chart of the percentage change from the previous quarter in non-residential structures’ investment. This has been one of the few pieces of good news from the economy as a whole. However, I have to wonder if this pace can continue considering the problems in the credit market.


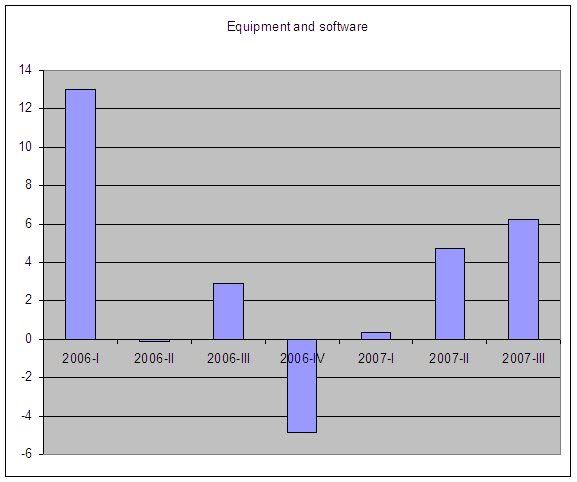
The chart for software and equipment investment -- which is the percentage change from the previous quarter -- was OK for the last few quarters. The fourth quarter's number is very important.

Financial conditions continue to pose a downside risk to the outlook. Market participants still express considerable uncertainty about the appropriate valuation of complex financial assets and about the extent of additional losses that may be disclosed in the future. On the whole, despite improvements in some areas, the financial situation remains fragile, and many funding markets remain impaired. Adverse economic or financial news thus has the potential to increase financial strains and to lead to further constraints on the supply of credit to households and businesses.


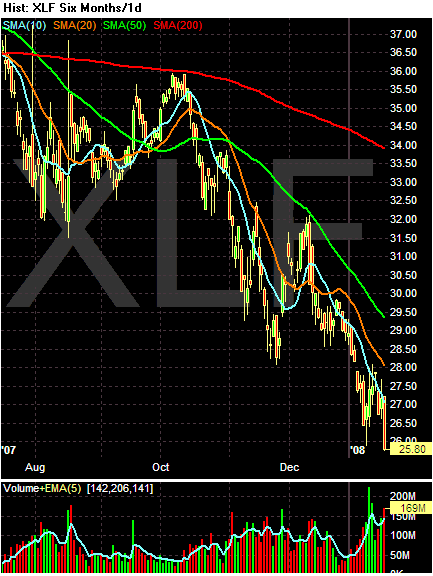
Translation – the financial sector is still taking it in the teeth. The chart confirms that analysis:


Note the following:

-- Prices are below the SMAs
-- The Shorter SMAs are below the longer SMAs
-- All the SMA are headed lower

Bottom line: this is an incredibly bearish chart.

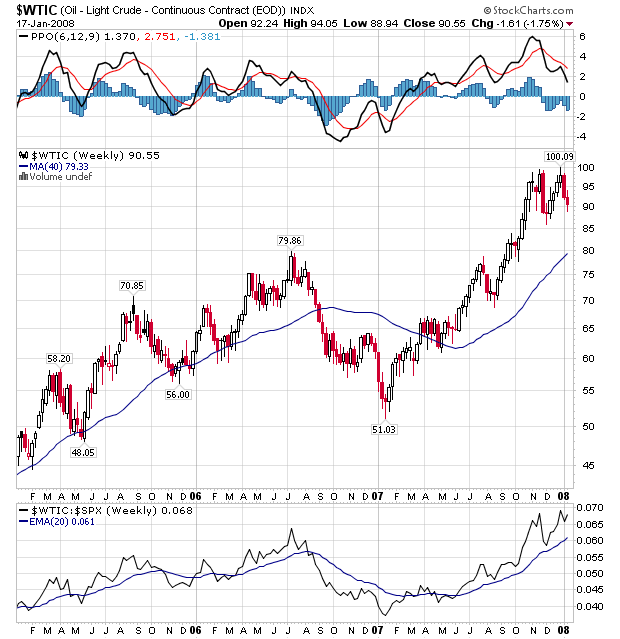
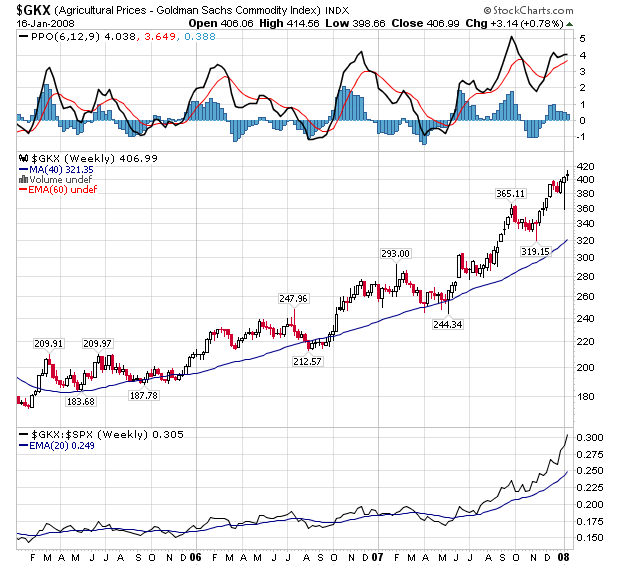
Even as the outlook for real activity has weakened, some important developments have occurred on the inflation front. Most notably, the same increase in oil prices that may be a negative influence on growth is also lifting overall consumer prices. Last year, food prices also increased exceptionally rapidly by recent standards, further boosting overall consumer price inflation. The most recent reading on overall personal consumption expenditure inflation showed that prices in November were 3.6 percent higher than they were a year earlier. Core price inflation (which excludes prices of food and energy) has stepped up recently as well, with November prices up almost 2-1/4 percent from a year earlier. Part of this rise may reflect pass-through of energy costs to the prices of core consumer goods and services, as well as the effects of the depreciation of the dollar on import prices, although some other prices--such as those for some medical and financial services--have also accelerated lately.1


Wow – you mean this chart of oil


And this of agricultural prices


Is important? I thought only core inflation mattered? Seriously, it’s good to see the Fed Chairman acknowledging that food and energy prices are important and are incredibly high right now.

The bottom line is Bernanke painted a pretty grim picture. And with good reason -- the picture is pretty damn grim right not.

Media Appearance

I'll be on KTLK at 3PM PST to talk about the markets.

Here's a link for streaming audio

Today's Markets

One writedown can ruin your ..., sorry, I wrote that yesterday .... and Monday.

Anyway, today it was Merrill's turn to pony up and they did. Then the Federal Reserve Chairman testified and indicated the economy isn't that good either (more on that tomorrow). As a result, the markets had a terrible, horrible, no good, very bad day. However, I want to use some longer time frames to show what is really happening in the markets.


Above is a 10-day, 5-minute chart of the SPYs. Notice how far and hard they have fallen over the last few days. They have dropped from 141.5 to 133.25 or almost 6%. That's a lot of territory to move on. If you take a look at today's volume there was a ton of it.


The QQQQs have a similar sell-off in progress. They have moved from 48 to 45.39 or about 5.4%.


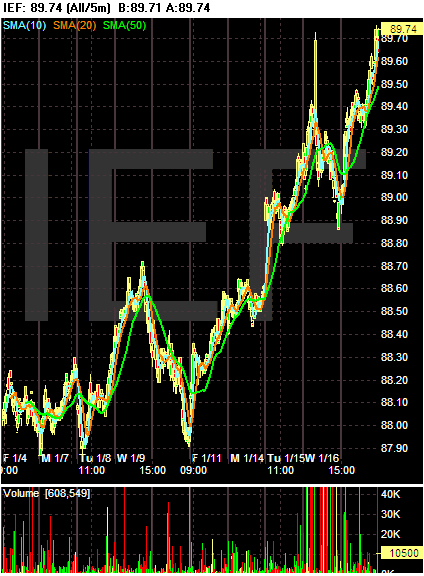
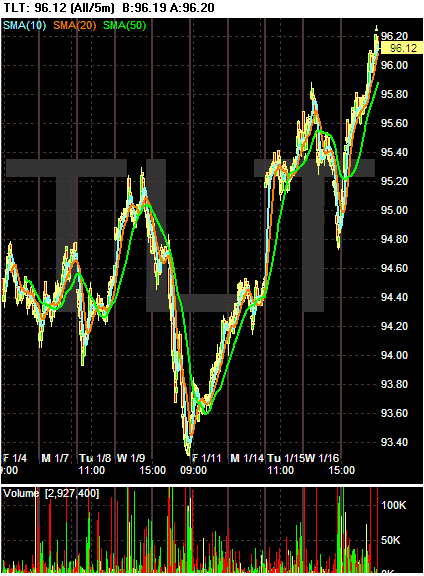
And the IWMs are clearly in a solidly established downtrend. Traders are fleeing the more speculative side of the market, and are flocking into Treasuries.


The 7-10 year Treasury ETF has increased from 87.9 to 89.70, or an increase of about 2%.


The 20+ year Treasury ETF has increased from 93.4 to 96.12 or almost 3%. This is despite the highest inflation rate in 17 years:

US inflation for all of 2007 hit the highest rate for 17 years, as surging energy and food costs pushed up prices, official data has shown.

Consumer prices rose by 4.1% for all of 2007, up sharply from a 2.5% increase in 2006, the US Labor Department said.


In other words -- safety is the buzzword right now.

Read This Now

Afraid to trade has a great post on how Google and Apple have fallen.

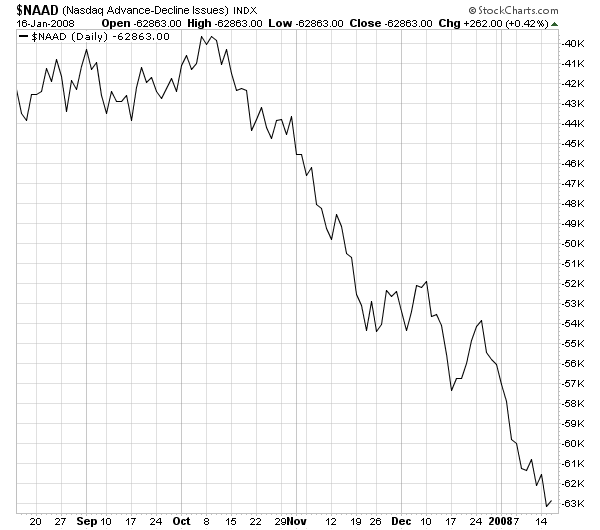
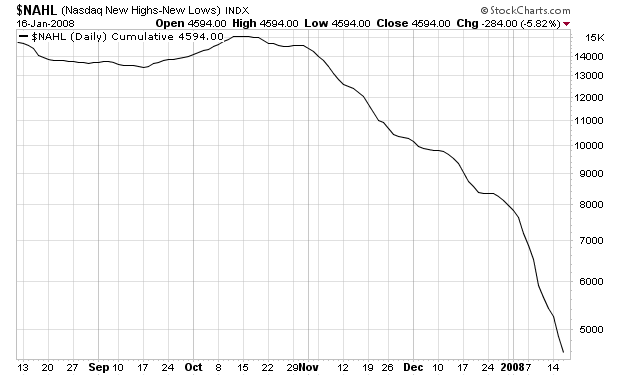
I wanted to add that you should consider this information in light of the following market breadth charts:


Fewer and fewer stocks are responsible for the markets advance. Google and Apple were two of those stocks that kept the market in good shape. With those falling from grace, we stand the chance of some rough times ahead.

"Inflation Expectations Are Well Grounded"

I was just watching some of Bernanke's testimony and he said that he believes inflation expectations are well-anchored.

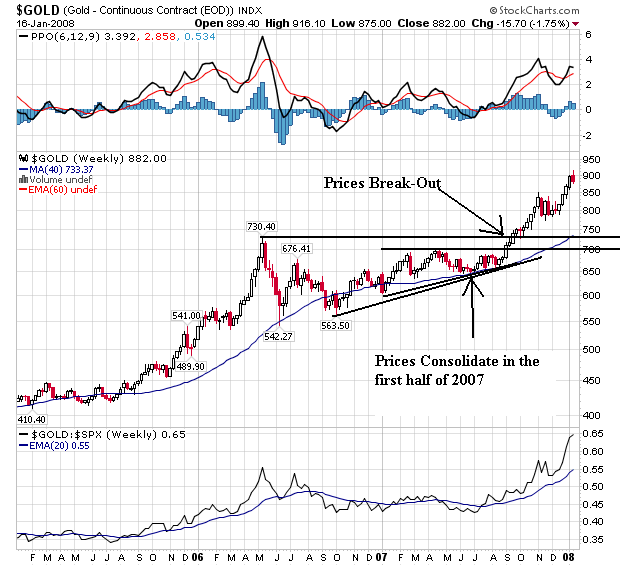
I think that's crap. Take a look at gold:


Gold prices have moved through a triangle consolidation pattern and broken above previous resistance to establish record highs. This should tell us one very important point: investors are clearly very worried about inflation.

In addition, consider agricultural prices:


That's a three year price increase from 180 to over 400. That's called inflation.

And then there is this little fact from the latest inflation report:

US inflation for all of 2007 hit the highest rate for 17 years, as surging energy and food costs pushed up prices, official data has shown.


I think people are very worried about inflation; why else would they be bidding up gold?

I Read the News Today, Oh Boy

Consider the following news from this week alone:

Embattled bank Citigroup Inc. announced a hefty $18.1 billion write-down for bad mortgage assets early Tuesday and slashed its dividend. The news of Citigroup's drastic efforts to shore up its balance sheet had been widely expected.


J.P. Morgan Chase & Co. said Wednesday its quarterly profit fell 34%, undercut by a major write-down of subprime assets, deteriorating performance in its home-equity business and a big drop in investment-banking activity.

.....

Net income dropped 34% to $2.97 billion, or 86 cents a share, from $4.53 billion, or $1.26 a share, earned in the final three months of 2006, as the company recorded a $1.3 billion write-down on its subprime positions.


Merrill Lynch & Co. reported a record loss after writing down at least $15 billion of failed investments, ousting its chief executive officer and losing almost half of its market value in 2007.


In less than a week, we've seen over $30 billion in writedowns. That's a ton a value lost.

The Beige Book + Charts

Yesterday, the Federal Reserve issued the Beige Book, which provides great anecdotal information on the economy. The previous link is to the entire piece, which I recommend for anyone. Here are the important excerpts (offset and in italics) with commentary and charts (what else).

Reports indicate that holiday sales were generally disappointing. Sales in the Atlanta, Boston, Chicago, Cleveland, Dallas, New York, Richmond, and San Francisco Districts were varyingly described as lackluster, weak, below year-ago levels, or mixed. Kansas City reported that spending was solid, but below expectations. Sales rose modestly according to Minneapolis, Philadelphia, and St. Louis reports. Atlanta and New York merchants noted that foreign buyers were a boost to holiday sales. Overall, the outlook for 2008 among retail merchants was cautious.


8 districts reported poor holiday sales. That's a clear majority and it is not a good sign. This information jibes with the latest retail economic data. The Census Bureau recently reported:

The U.S. Census Bureau announced today that advance estimates of U.S. retail and food services sales for December, adjusted for seasonal variation and holiday and trading-day differences, but not for price changes, were $382.9 billion, a decrease of 0.4 percent (±0.7%)* from the previous month, but 4.1 percent (±0.7%) above December 2006. Total sales for the 12 months of 2007 were up 4.2 percent (±0.4%) from 2006. Total sales for the October through December 2007 period were up 4.9 percent (±0.5%) from the same period a year ago. The October to November 2007 percent change was revised from +1.2 percent (±0.7%) to +1.0 percent (±0.2%).


Also note that traders have been dumping retail shares.
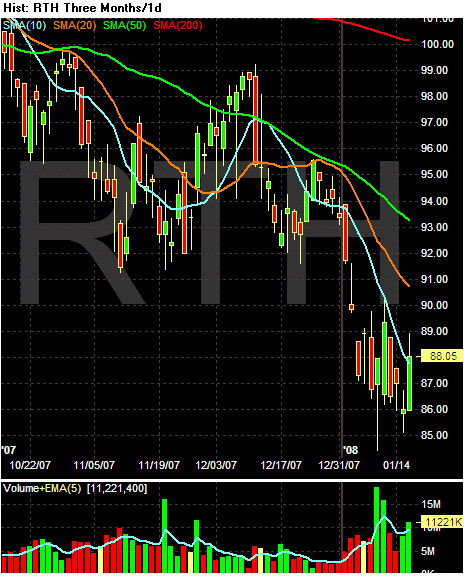


Notice the following with the retail ETF:

-- Prices are more than 10% below the 200 day SMA

-- All the SMAs are heading lower

-- The shorter SMAs are below the longer SMAs

-- Prices are below 3 of the SMAs and are just barely above the 10 day SMA.

In short -- traders are clearly selling the retail sector.

Most Districts reported that vehicle sales for late 2007 were below year-ago levels. However, the Minneapolis report noted strong demand from area farmers and Canadians purchasing vehicles across the border. The Atlanta and Kansas City Districts reported that sluggish vehicle demand has resulted in unexpected inventory accumulation. However, imports and fuel-efficient vehicles continued to sell well according to the Philadelphia, Kansas City, and Dallas reports. Atlanta noted that some foreign brands had turned to fleet sales to offset generally weaker retail demand. Dealers in Philadelphia and Cleveland anticipated that sales in 2008 would be flat to lower than in 2007.


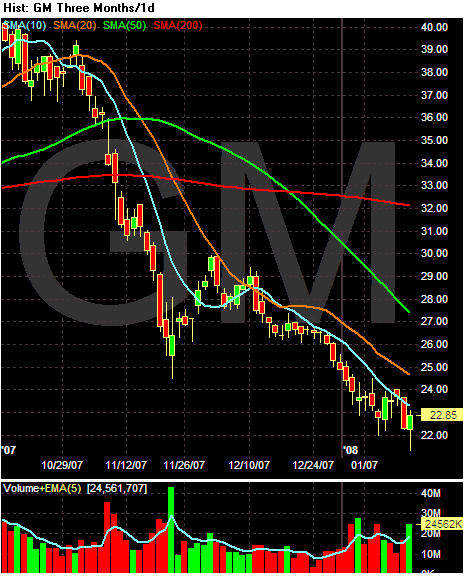
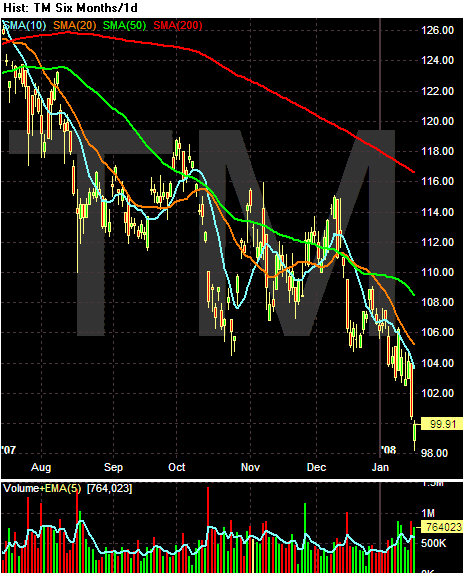
All the auto markets -- even Toyota -- are taking a hit right now.
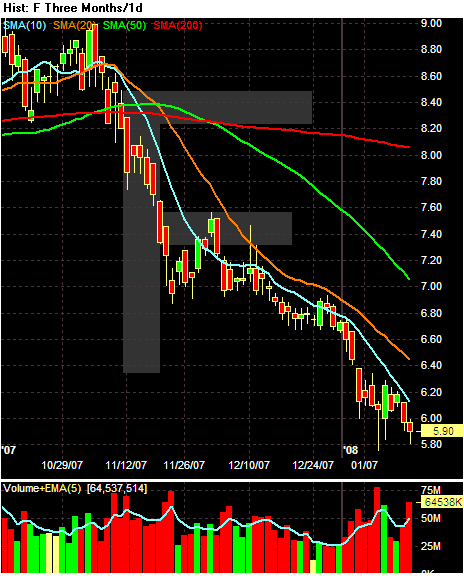


All three charts are pretty ugly. Notice:

-- Prices are below all the SMAs

-- All the SMAs are headed lower

-- Prices are below the 200 day SMA (yes, even Toyota).

Most reports cited robust demand in several nonfinancial service industries including health care, hospitality, legal, and insurance. According to Atlanta, the demand for engineers, particularly in petrochemical fields, was very strong. Reports on temporary staffing services were mixed. For instance, Dallas and Philadelphia noted that employment firms reported weaker demand for temporary workers, whereas New York and Richmond reported relatively strong demand.


Health care is pretty resistant to economic downturns, so this shouldn't be a surprise. In addition, as the US population gets older, the entire field of older person care will continue to grow. Health care employment was on of the continuing bright spots for this cycle.
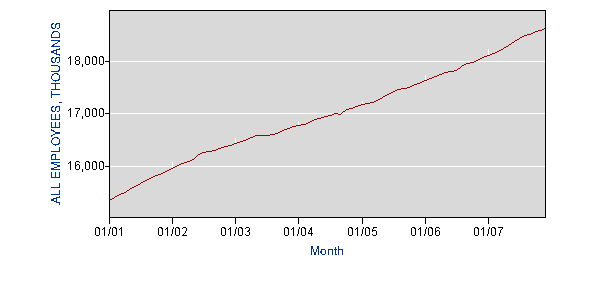


And "leisure and hospitality" (think, "you want fries with that) has been doing well.
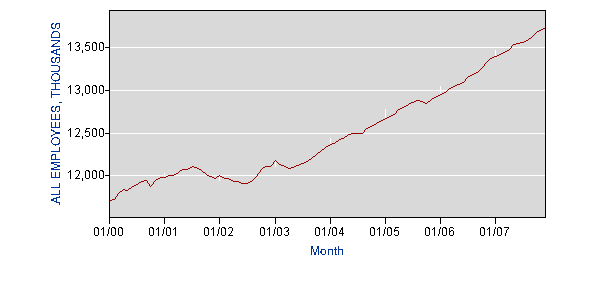


As has professional services:
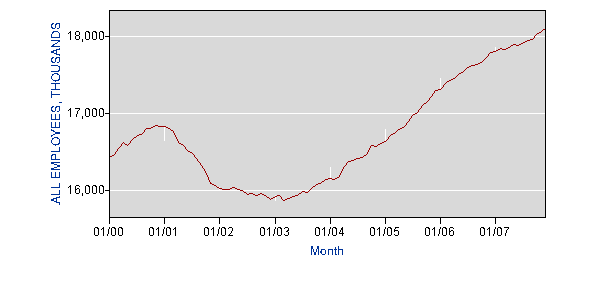


I have to wonder about the long-term viability of professional services with the housing slowdown going.

Reports on manufacturing activity varied. Kansas City reported that manufacturing was expanding and that manufacturers were relatively upbeat. Cleveland reported that manufacturing output remained steady overall, whereas Dallas indicated that conditions continued to soften. New York reported that manufacturing activity appeared to weaken somewhat in early December, but noted some improvement later in the month. Among the positive reports, San Francisco noted that production and new orders for commercial aircraft and parts remained solid, while sales of information-technology products continued to increase moderately. Boston said that sales of aircraft equipment and pharmaceuticals continued to rise at a robust rate. Atlanta and Minneapolis noted that defense and energy-related manufacturers reported strong activity. St. Louis and San Francisco reported that the local food production industry was expanding.
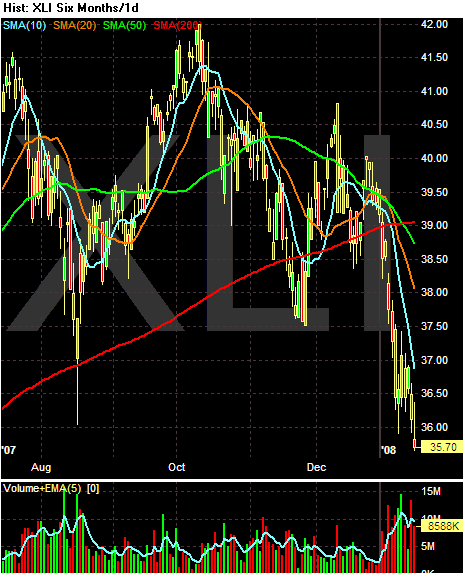


I noted the industrials a few days ago. This sector is not looking good right now.

-- Prices have moved below the 200 day SMA

-- The shorter SMAs are below the longer SMAs

-- Prices are below all the SMAs, which will pull the overall trend lower

-- The shorter SMAs have crossed the 200 day SMA, adding downward pressure to the long-term trend.

Conditions in most housing markets remained quite weak through year-end. The pace of sales continued to be sluggish, and inventories persisted at historically high levels according to most Districts. Home construction levels continued to decline according to Atlanta, Chicago, Dallas, Kansas City, and St. Louis reports. Reports on home prices varied. While Dallas observed that home prices were steady, Atlanta, Cleveland, Kansas City, New York, and Richmond reported that prices declined; the Boston and San Francisco Districts said that changes in home prices were mixed. Overall, contacts anticipate that housing markets will remain weak during the first part of 2008.


Gee -- housing's a wreck. Who would have thought that?
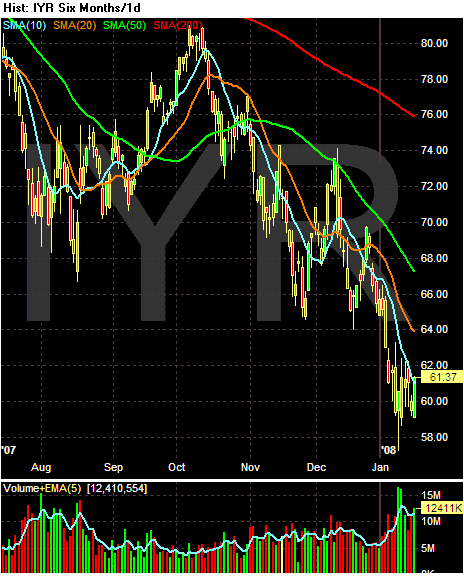


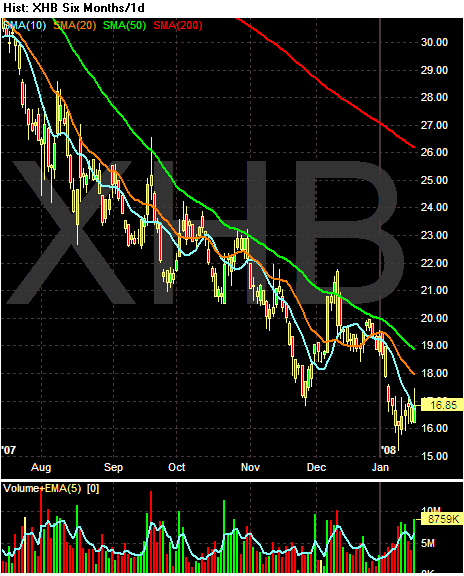
The real estate and homebuilders ETF are both very bearish. Notice the following:

-- Prices are below the 200 day SMA

-- The shorter SMAs are below the longer SMAs

-- All the SMAs are headed lower

-- Prices are below all the SMAs

Reports suggest that both business and consumer lending activity slowed in most Districts from mid-November through December. Residential mortgage lending continued to contract in all Districts while refinancing activity varied. For instance, Chicago and Richmond noted increased refinancing activity, but New York cited widespread declines in refinancing. Reports on commercial real estate loan demand were also mixed, although Dallas and Cleveland noted relatively healthy demand. Most reports indicated that credit standards for most loan categories had tightened over the period. Downward pressure on deposits was noted by Chicago, New York, Philadelphia, St Louis, Kansas City, and Dallas. Several Districts reported declines in loan quality and increased delinquencies.


The US financial system is a wreck right now.
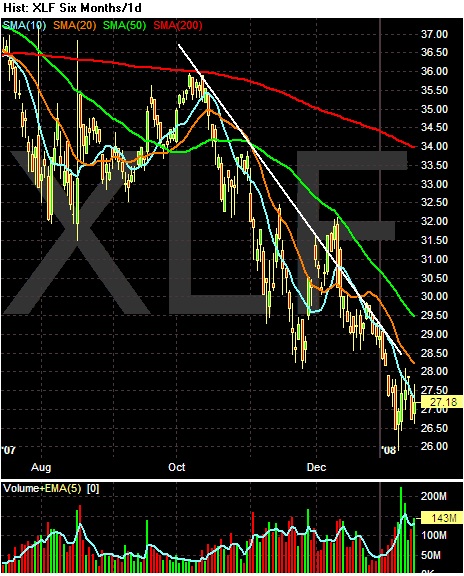


Notice the following:

-- Prices are below the 200 day SMA

-- The shorter SMAs are below the longer SMAs

-- All the SMAs are headed lower

-- Prices are below all the SMAs

The performance of the agricultural sector across Districts was generally favorable. Upbeat conditions in Chicago, Minneapolis, and San Francisco were attributed to a combination of higher crop prices and favorable weather. Dallas and San Francisco reported strong domestic and global demand for their products. Kansas City reported that strong demand and low inventories boosted prices and income for crop producers. However, despite recent rains, conditions for drought-stricken areas in the Atlanta and Richmond Districts remained generally poor.

Activity in the energy sector increased according to the Atlanta, Dallas, Kansas City, and Minneapolis Districts. Dallas noted a sharp rise in the Texas rig count while Kansas City cited strong drilling activity in Oklahoma and Colorado. However, seasonal factors dampened drilling activity in the Cleveland District, and reports on coal production in the region were mixed. Atlanta indicated that Gulf Coast crude inventories were low, but new offshore platforms should help boost production in 2008.
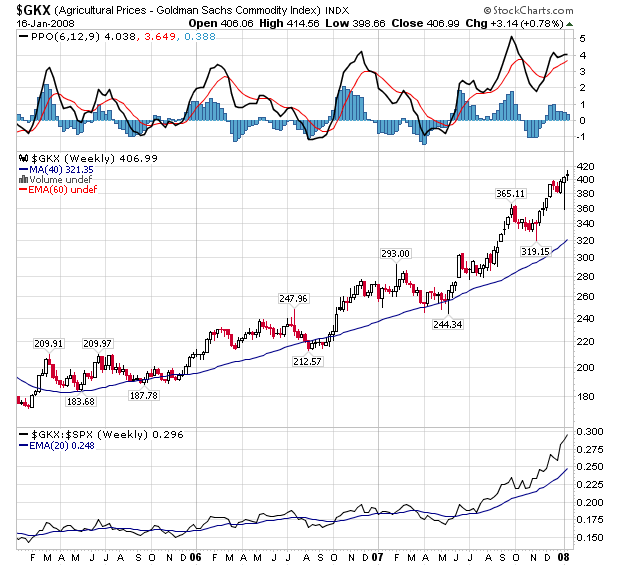


Agricultural prices are in the middle of a three year bull run. There are strong fundamental reasons for this: India's and China's increased living standards, the use of agricultural additives to the fuel suppply and drought issues in some parts of the world.
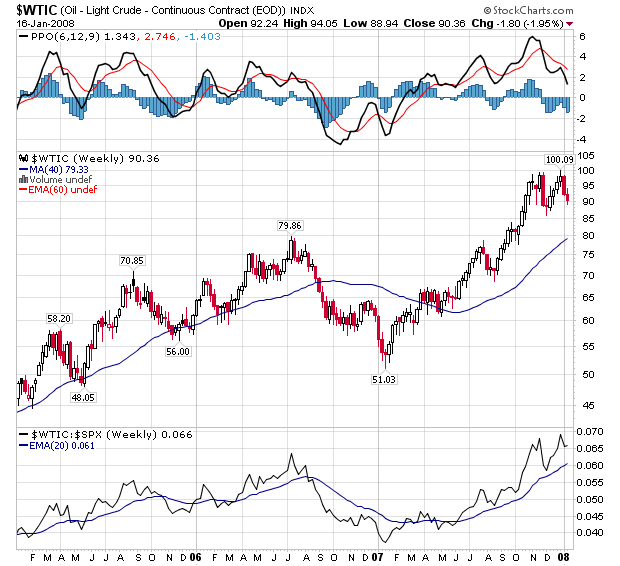


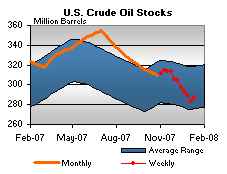
Yesterday I speculated that oil may be forming a double top. Something I will add to that analysis is the continuing decline of US stockpiles.


And the continuing move lower by the US dollar:
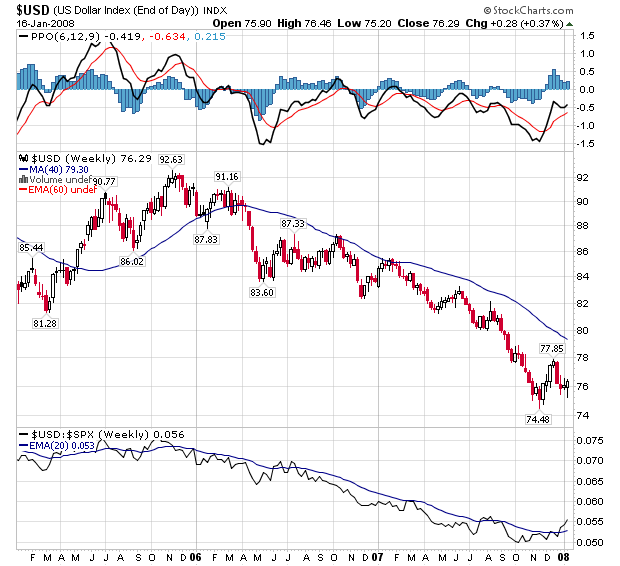


Because oil is priced in dollars, a drop in the dollar is a de facto increase in oil's price.
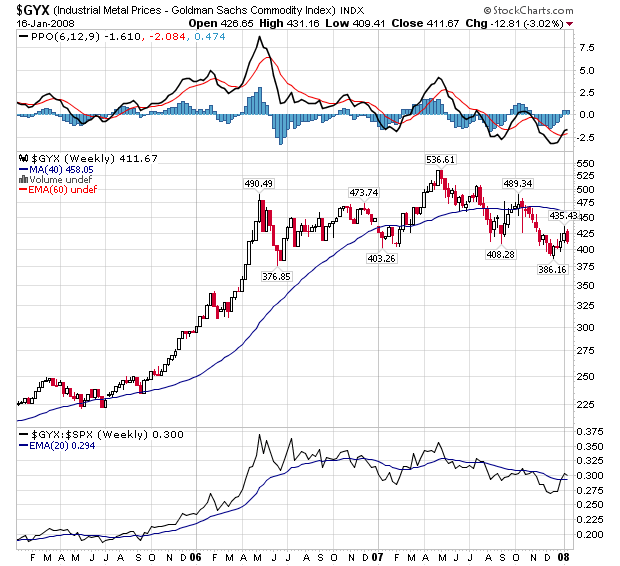


Industrial metals have been in a trading range/consolidation pattern for the last two years. However,
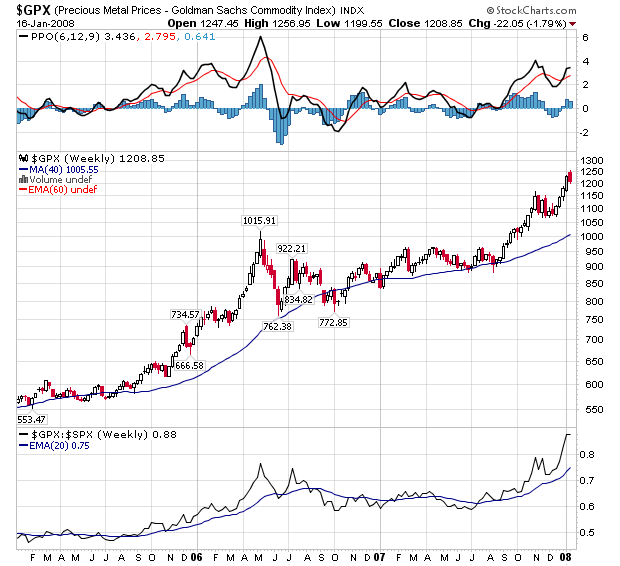


Precious metals are increasing, largely as an inflation hedge.

There really isn't that much good news in the report. Outside of agricultural prices and exports everything else is in questionable territory.
Wednesday, January 16, 2008

Today's Markets

One writedown can ruin your whole day -- sorry, I wrote that yesterday. Anyway, today it was JP Morgans chance to announce a writedown and they did so.


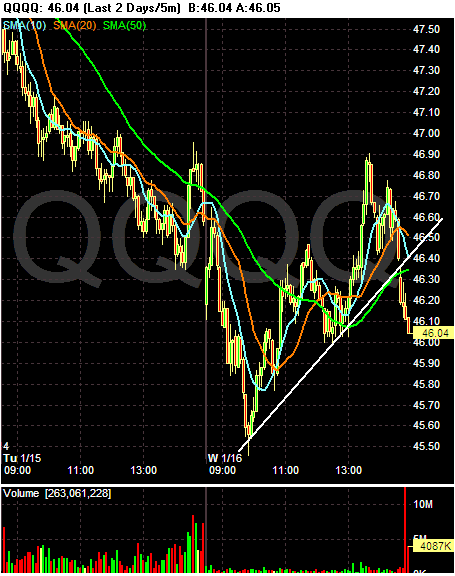
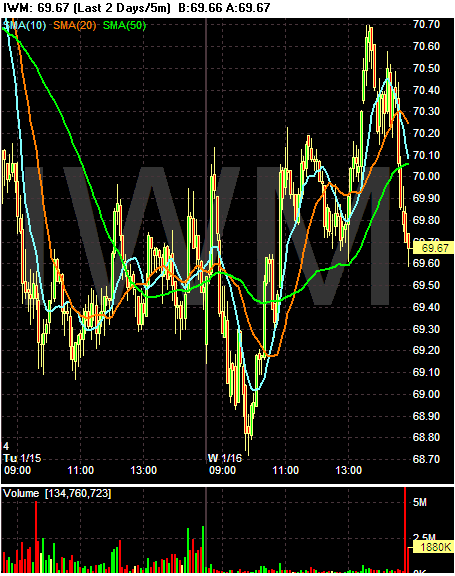
All of the 5-minute charts are the same. The markets sold-off, rallied and then sold-off at the end of trading on very heavy volume. The end-of-day selling indicates traders are still very nervous about the markets are aren't willing to hold anything overnight. Considering we are in the middle of earnings season and we have seen some serious writedowns this week alone, I can't say I blame them.


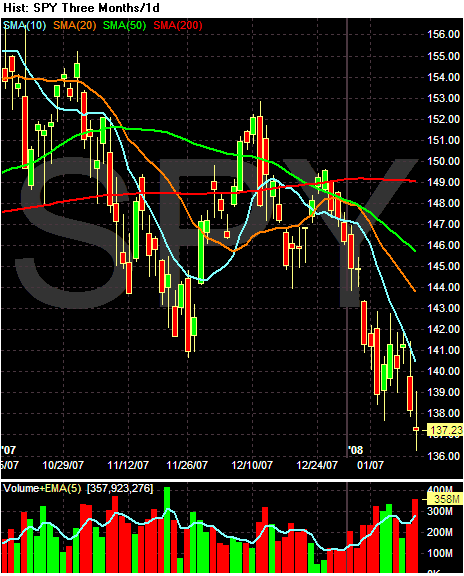
On the daily chart of the SPYs, notice

-- Prices are below the moving averages,

-- the Shorter SMAs are below the longer SMAs

-- Prices are below the 200 day SMA

-- Today we had extremely heavy volume and the formation of a spinning top, indicating the market is undecided where it wants to go next.


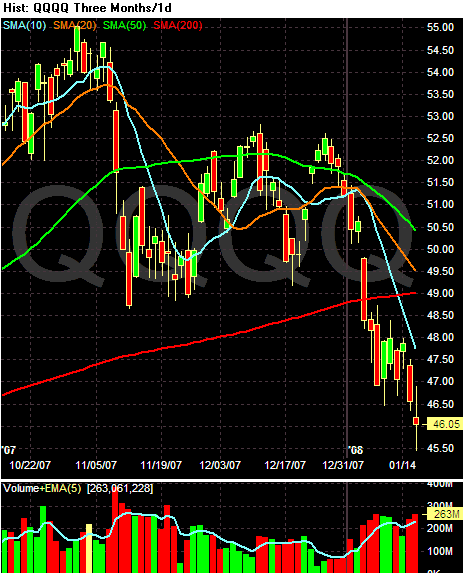
This chart should cause some concern. Notice this index was the last to fall below the 200 day SMA. In addition, the 20 day SMA has moved below the 200 day SMA, and the 20 day SMA will probably do so within the next week or so. In addition, the 10, 20 and 50 day SMAs are all moving lower right now.


Notice the following:

-- Prices are below the moving averages,

-- the Shorter SMAs are below the longer SMAs

-- Prices are below the 200 day SMA

-- Prices are more than 10% below the 200 day SMA.