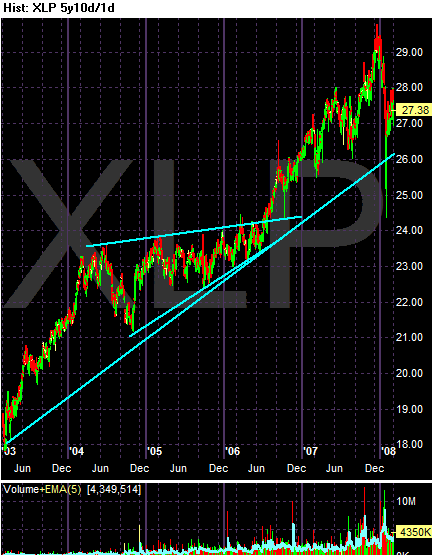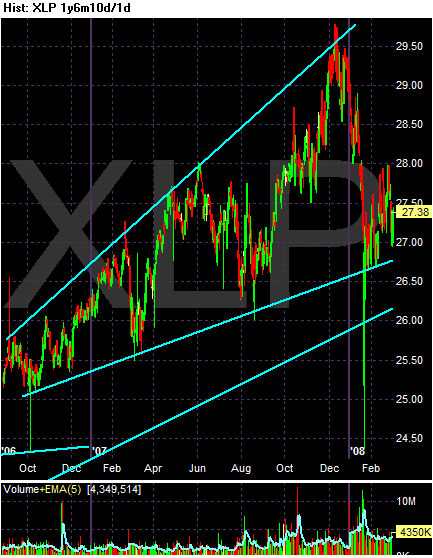
As with the utility sector, this area of the market is still in an uptrend.

However -- also like the utility sector - this sector is in the middle of a broadening formation which is considered a reversal pattern.

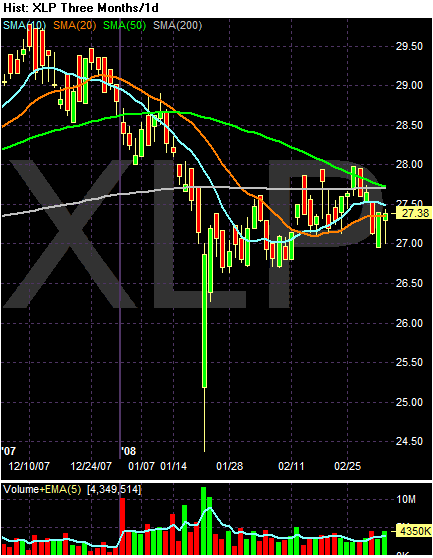
The SMAs tell us:
-- Prices are just below the 200 day SMA, indicating we're in a bear market (but just barely).
-- Three SMAs -- the 10, 20, and 200 -- are nearly horizontal.
-- Prices and the SMAs are tightly packed indicating a clear lack of direction.