Saturday, February 23, 2019
Weekly Indicators for February 18 - 22 at Seeking Alpha
- by New Deal democrat
My Weekly Indicators post is up at Seeking Alpha.
The short leading indicators have sunk to a level that is consistent with an oncoming recession in the next 3 - 8 months. But the recent government shutdown may still be skewing some of the data.
As always, not only is clicking and reading hopefully informative for you, but it also helps reward me a little bit for the effort I put in to this work.
Friday, February 22, 2019
Housing may bottom this spring
- by New Deal democrat
Despite yesterday’s poor existing home sales report, which was the worst in over three years, the bottom in housing may be near.
This post is up at Seeking Alpha. As always, reading the post should be helpful to you, and renumerates me just a bit for my efforts.
Thursday, February 21, 2019
Industrial transportation stalls out
- by New Deal democrat
The two main forms of transporting goods, rail and trucking, have both gone negative YoY, and on average over the last 3+ months are only slightly better than zero. This both has implications for the broader economy, and confirms some other poor data.
This post is up at Seeking Alpha.
Wednesday, February 20, 2019
100 years of industrial production
- by New Deal democrat
This is a post that can literally be written only once in 100 years!
Because as of last Friday, it has been exactly 100 years since the first publication of industrial production by the Fed in January 1919. So this is a good time to take a sweeping historical look at production in the United States.
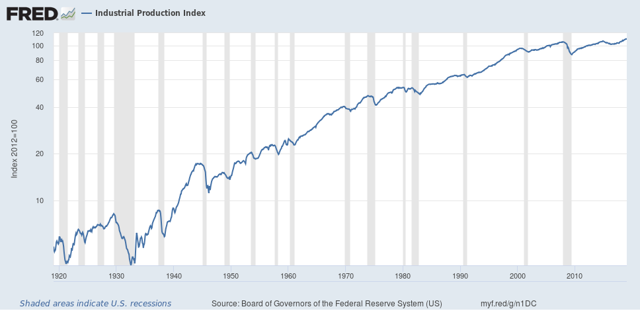
The first graph below is the entire 100 year history, on log scale so that equal percentage changes in each time period are calibrated equally:
Because as of last Friday, it has been exactly 100 years since the first publication of industrial production by the Fed in January 1919. So this is a good time to take a sweeping historical look at production in the United States.
The first graph below is the entire 100 year history, on log scale so that equal percentage changes in each time period are calibrated equally:
A few features stand out: the Great Depression, the World War 2 boom, and two downshifts in the long term trend: first in the 1970s-1999, and second from 1999 to the present.
In fact, the past 20 years have been the slowest secular period since publication of industrial production started 100 years ago. As shown in the below graph, normed to 100 in June 1999, production has only grown 15% in the 20 years since. It grew just under 10% during the 2000s expansion, and only about 5% in the last 11 years:
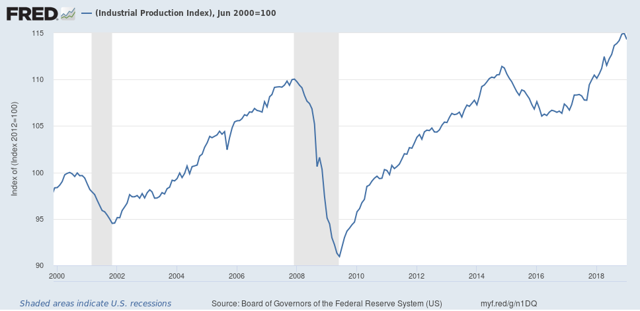
In fact, the past 20 years have been the slowest secular period since publication of industrial production started 100 years ago. As shown in the below graph, normed to 100 in June 1999, production has only grown 15% in the 20 years since. It grew just under 10% during the 2000s expansion, and only about 5% in the last 11 years:
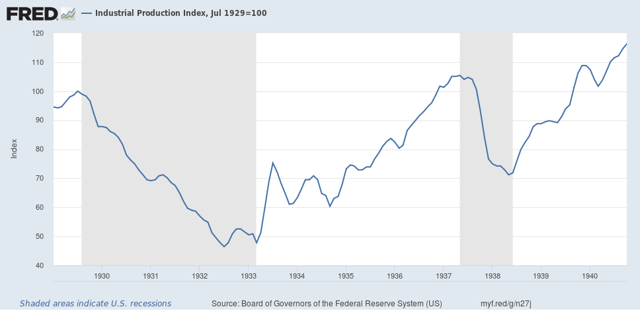
The worst previous period was the 1929-37 portion of the Great Depression, but even there production grew 6% by the end of that 8 year period, and exceed a 15% gain from 1929 by late 1940, 11 years later:
The situation is even worse when we subtract mining and utilities, and focus just on manufacturing. Here’s the 100 year log scale growth in that sector:
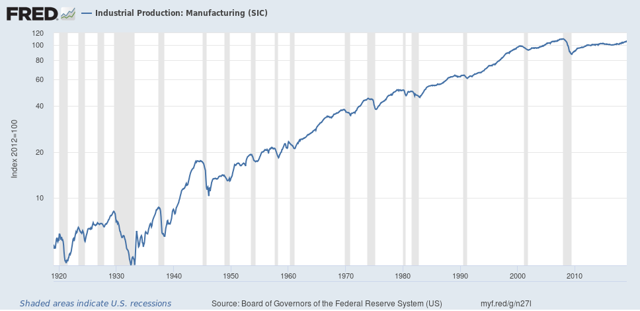
Note that growth has for all intents and purposes stopped since 1999.
Again focusing just on the last 20 years, we see that manufacturing production grew just 11% during the 2000s expansion, and even now 11 years later, has still not equaled the 2007 peak:
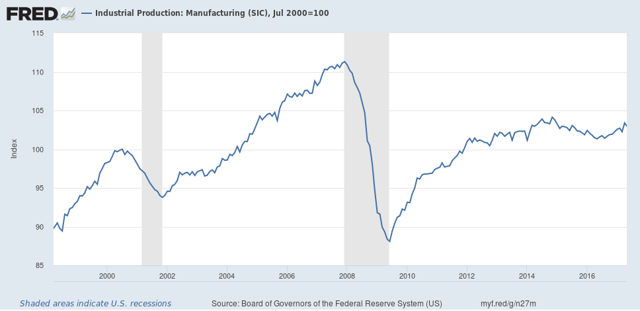
Total growth over the last 20 years in manufacturing has been just 3.4%.
Taking the long historical view shows the relative — and in the last decade, absolute — decline of the US as a manufacturing power. And it also puts paid to the notion that, at least in the last 20 years, the decline in manufacturing employment is mainly about productivity and mechanization. If it woeren’t for the rebirth of “Saudi America” in the energy sector over the last 10 years, industrial production growth in the US would have completely stopped.
Taking the long historical view shows the relative — and in the last decade, absolute — decline of the US as a manufacturing power. And it also puts paid to the notion that, at least in the last 20 years, the decline in manufacturing employment is mainly about productivity and mechanization. If it woeren’t for the rebirth of “Saudi America” in the energy sector over the last 10 years, industrial production growth in the US would have completely stopped.
Tuesday, February 19, 2019
Wages continued to improve through January
- by New Deal democrat
One item I didn’t get around to in the last couple of weeks is how wages performed as of January’s jobs report. And the basic answer is: pretty good!
The first graph below shows real, inflation adjusted average wage gains for non-managerial workers measured YoY:
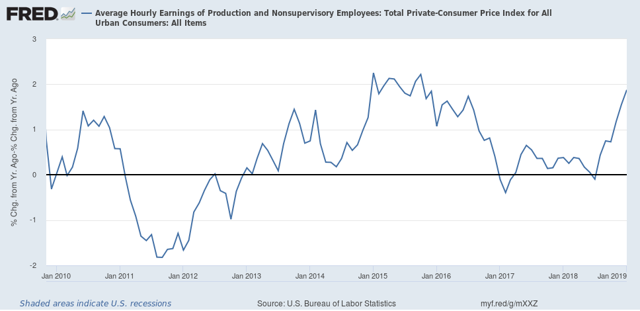
The first graph below shows real, inflation adjusted average wage gains for non-managerial workers measured YoY:
As of January they were up +1.9%. This is the best showing except for a few months in 2015.
As Jared Bernstein has shown, the “real” gains in wages have a lot to do with the price of gas (blue in the graph below). But in the last two months they have risen the most in the last 8 years in real terms ex-energy:
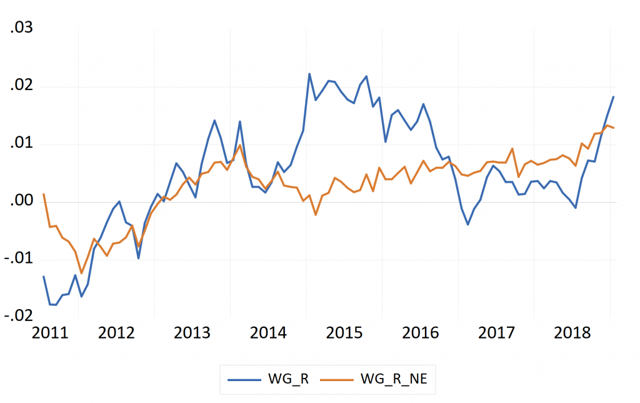
So average workers are finally making some real headway.
By the way, this also shows up in the Q4 2018 Employment Cost Index that was released three weeks ago:
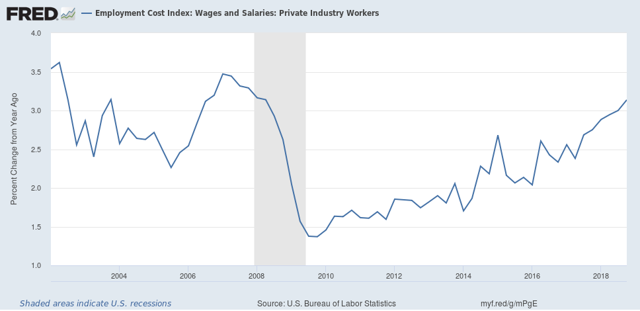
By the way, this also shows up in the Q4 2018 Employment Cost Index that was released three weeks ago:
The ECI measures *median* wages, i.e., the 50th percentile level, and so does away with the “Bill Gates enters a bar” problem. At +3.1% YoY, this is the best showing since late 2006-early 2008.
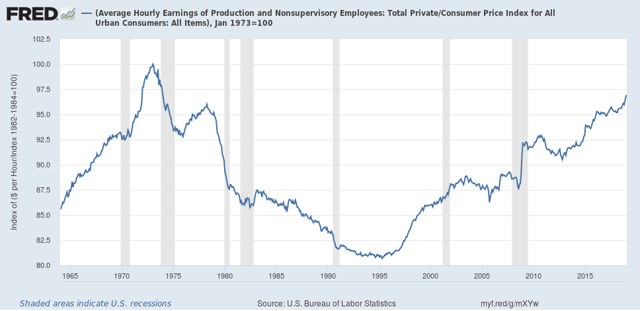
Returning to real inflation adjusted average wages, they improved again and are now only 3% below their 1973 peak:
Finally, total wage growth for non-managerial workers since the bottom in October 2009 is now up +28.5%:
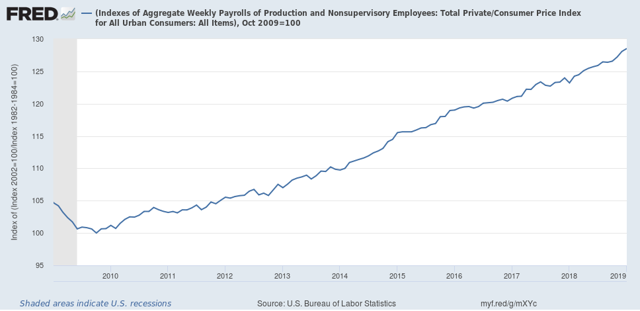 Total wage growth from this entire expansion has only been exceeded by the 1960s and 1990s expansion. The bad news, of course, is that it took 9 years to get here.
Returning to real inflation adjusted average wages, they improved again and are now only 3% below their 1973 peak:
Finally, total wage growth for non-managerial workers since the bottom in October 2009 is now up +28.5%:
Monday, February 18, 2019
It’s Presidents Day, and we’re still basically flying blind on the eoncomy
- by New Deal democrat
Not only are the markets closed today for President’s Day, but this entire week is about the emptiest I can ever recall for economic data. Literally the only data of note is going to be released on Thursday, and except for weekly jobless claims, even that is not what I would generally consider first-order metrics.
Even worse, we are still basically flying blind due to the government shutdown. The only data of note that had been on hiatus, and has been updated since it ended was last week’s retail sales for December. And that report was jarring enough to justify worrying that not only did the shutdown make us economically blind, but it itself may have further weakened an already weakening economy. So we may be in for some more jarring surprises when December housing starts and permits, December income and spending, and Q4 GDP finally get released next week.
There are a couple of series I’ve been meaning to update, so maybe I’ll get around to them. But, don’t be surprised if I don’t post any material for a day or two, or post a brief note on a political topic.
Subscribe to:
Posts (Atom)