Saturday, October 5, 2019
Weekly Indicators for September 30 - October 4 at Seeking Alpha
- by New Deal democrat
My Weekly Indicators post is up at Seeking Alpha.
It’s pretty clear that manufacturing is in a recession right now. The economy as a whole isn’t because the consumer sector of the economy is still doing fairly well.
As usual, clicking over and reading should bring you up to the minute on the economy, and reward me a little bit for my efforts.
Friday, October 4, 2019
September jobs report: excellent in coincident and lagging sectors, cautionary in leading sectors
- by New Deal democrat
HEADLINES:
- +136,000 jobs added (+135,000 ex-Census)
- U3 unemployment rate declined -0.2% from 3.7% to 3.5% (NEW LOW)
- U6 underemployment rate declined -0.3% from 7.2% to 6.9% (NEW LOW)
Leading employment indicators of a slowdown or recession
I am highlighting these because many leading indicators overall strongly suggest that an employment slowdown is coming. The following more leading numbers in the report tell us about where the economy is likely to be a few months from now. These were mixed.
- the average manufacturing workweek declined -0.1 from 40.6 hours to 40.5 hours. This is one of the 10 components of the LEI and is negative.
- Manufacturing jobs declined by -2,000. YoY manufacturing is up 117,000, a deceleration from 2018’s pace.
- construction jobs rose by 7,000. YoY construction jobs are up 156,000, also a deceleration from summer 2018. Residential construction jobs, which are even more leading, rose by 500.
- temporary jobs rose by 10,200. (NOTE: July, which was originally reported at +10,500, is now shown at -2,200. August was revised down by -900 to +14,500).
- the number of people unemployed for 5 weeks or less declined by -339,000 from 2,207,000 to 1,868,000. (NEW EXPANSION LOW)
Wages and participation rates
Here are the headlines on wages and the broader measures of underemployment:
Here are the headlines on wages and the broader measures of underemployment:
- Not in Labor Force, but Want a Job Now: declined by -270,000 from 5.150 million to 4.880 million (NEW EXPANSION LOW)
- Part time for economic reasons: declined by -31,000 from 4.381 million to 4.350 million
- Employment/population ratio ages 25-54: rose +0.1% from 80.0% to 80.1%.
- Average Hourly Earnings for Production and Nonsupervisory Personnel: rose $.04 to $23.65, up +3.5% YoY. This is still a slight decline from the recent YoY% change peak. (Note: you may be reading different information about wages elsewhere. They are citing average wages for all private workers. I use wages for nonsupervisory personnel, to come closer to the situation for ordinary workers.)
Holding Trump accountable on manufacturing and mining jobs
Trump specifically campaigned on bringing back manufacturing and mining jobs. Is he keeping this promise?
Trump specifically campaigned on bringing back manufacturing and mining jobs. Is he keeping this promise?
- Manufacturing jobs rose an average of +9,750/month in the past year vs. the last seven years of Obama's presidency in which an average of +10,300 manufacturing jobs were added each month.
- Coal mining jobs rose 200, an average of 125 jobs/month in the past year vs. the last seven years of Obama's presidency in which an average of -300 jobs were lost each month
Other important coincident indicators help us paint a more complete picture of the present:
- Overtime was unchanged at 3.2 hours
- Professional and business employment (generally higher-paying jobs) rose by +34,000 and is up +437,000 YoY.
- the index of aggregate hours worked for non-managerial workers rose by 0.1%
- the index of aggregate payrolls for non-managerial workers rose by 0.3%
Other news included:
- the alternate jobs number contained in the more volatile household survey rose by 371,000 jobs. This represents an increase of 2,200,000 jobs YoY vs. 2,147,000 in the establishment survey.
- Government jobs rose by 22,000 (21,000 ex-census).
- the overall employment to population ratio for all ages 16 and up rose 0.1% to 61.0% m/m and is up 0.6% YoY.
- The labor force participation rate was unchanged at 63.2% and is up 0.5% YoY.
SUMMARY
This was a excellent report in almost all respects outside of the headline jobs number. New expansion lows were set for unemployment, underemployment, short term unemployment, and those who want a job now but have not looked. New expansion highs were set for prime age employment, participation, and aggregate hours and payrolls. Non-supervisory wages improved tepidly m/m, but growth remains at expansion highs YoY.
The only fly in the ointment, aside from the headline number, was as I expected in the leading sectors of the establishment survey. Manufacturing hours fell, as did manufacturing employment. Construction employment rose slightly, especially as to the most leading residential construction sector. And while temporary employment rose “strongly,” August was revised down slightly, and July, which was originally reported up 2,200, is now shown as a decline of -10,500.
In short, a great report in the coincident and lagging aspects, with some pronounced weakness in the leading aspects.
Thursday, October 3, 2019
September 2019 motor vehicle sales
- by New Deal democrat
Motor vehicle sales are a short leading indicator. In particular, on the consumer side, they have typically rolled over after housing but before consumer nondurables, so they are useful in gauging the health of the consumer.
More recently I’ve started tracking heavy truck sales as well. That’s because, in addition for being a proxy for the producer side of the economy, as the below graph shows, they are much less noisy that light vehicle sales, and susceptible to fewer false positives (note: measure is quarterly to cut down further on noise):
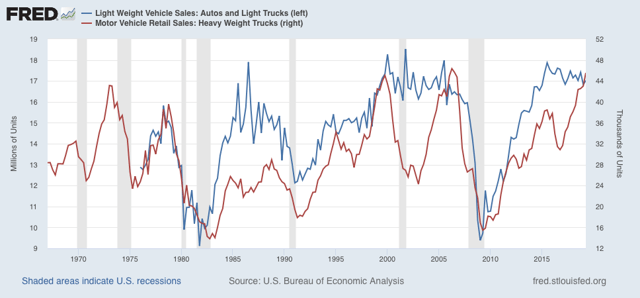
With the exception of 1969, heavy truck sales have always declined ~20% or more from peak prior to the onset of a recession. The only false positives are 1984-86, 1994-96, and 2015-16, all of which were pronounced slowdowns. As you can see, through Q2 these were growing.
Car and light truck sales have typically declined about 10% or more on a three month moving average basis before a recession hits, which would be below 16.5 million vehicles annualized, but there is lots more noise.
Zooming in on the past few years on a monthly basis, the below graphs norms September 2019’s sales levels (not yet shown on FRED) to 100:
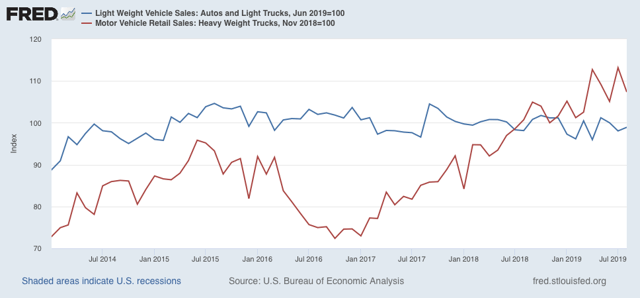
In September, 17.2 million light vehicles were sold on an annualized basis, down only about 5% from peak. But 41,800 heavy trucks were sold, a -11.6% decline from July’s record high.
Only one month, and not nearly enough to warrant any imminent recession concerns. But it’s worth noting that the one other time that truck sales declined sharply before auto sales was in the year prior to the 2001 producer-led recession. If heavy truck sales should fall by -15% or more, which would be to the 40,200 or fewer monthly, that would be a yellow flag. For now, considering the contraction shown in the ISM manufacturing index, heavy truck sales bear watching more closely.
Wednesday, October 2, 2019
Expect a weak report for the leading jobs sectors on Friday
- by New Deal democrat
September motor vehicle sales will be reported later today, after the domestic US manufacturers post their numbers. Sales of all other vehicles were down -13% YoY, but that is without seasonal adjustment including for Labor Day, so the seasonally adjusted sales might tell a completely different story.
In the meantime, with an eye towards Friday’s jobs report, let’s take a look at what is happening with temporary help services, one of the most leading components of employment.
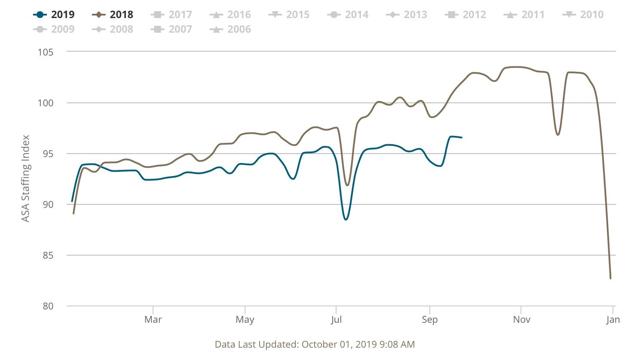
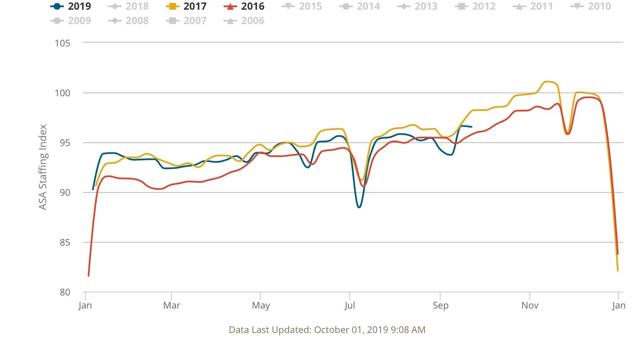
Every week I update the American Staffing Index, (from which site the first four graphs below are taken) which has a 14 year history and in that time has correlated pretty well with the final temp help employment numbers. This year it has turned increasingly negative, and this week had the most negative YoY reading so far, down -5.45% YoY for the single week, and off -4.9% YoY as a 4 week moving average:
Maybe the best way to see how bad this is, is this non-seasonally adjusted look at the index’s entire history:
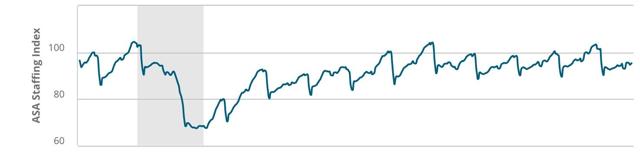
Note how the index typically rises over the course of the year until plunging right after the Christmas and New Year’s holidays — but this year has barely risen at all, the worst performance since its 2008 plunge during the Great Recession.
Let’s also compare this year with several other years during this expansion that have been relatively week. First, here’s 2016-17:
And here’s 2011-12:
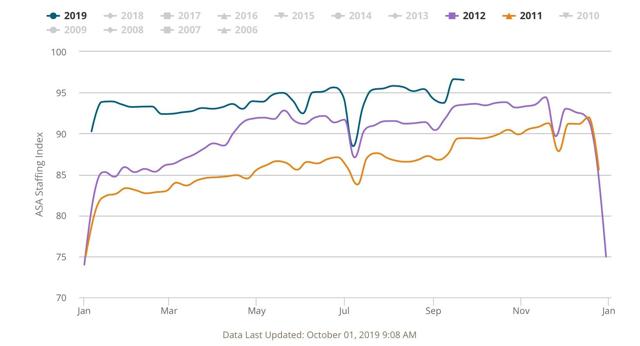
This year is a little weaker than 2011, and not quite as weak as mid-2012. It’s also pretty close to the middle portion of 2016 and the first 6 months of 2017.
Now let’s look at temporary jobs, averaged quarterly, from the jobs reports from 2011 to the present:
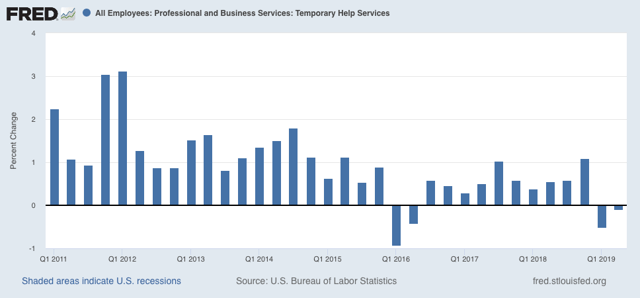
Although there will still gains, there was a big downshift in 2012, outright losses in early 2016, and continuing weakness, albeit with gains, through 2017. There have been losses in both Q1 and Q2 of this year.
As I reported a few weeks ago, the pattern has been for temp jobs to “surprisingly” increase in the initial jobs report, only to be revised significantly downward over the next two months. Last month August’s gain was initially reported at +15,400.
If Friday’s report runs true to form, there will be “surprising” gains in temp jobs, but a big downward revision to August’s number. I fully expect that the final, combined number for August and September will be negative.
The other two leading jobs sectors are residential construction and manufacturing. Residential construction has picked up, so that number is likely to be positive, but the ISM manufacturing report’s employment subindex showed contraction for the second month in a row.
The bottom line is, I expect continued weakness in the leading sectors of the jobs report on Friday.
Tuesday, October 1, 2019
Once again, two sharply contrasting reports to start the month
- by New Deal democrat
One month ago, I wrote that the first reports in September, construction spending and the ISM manufacturing index, showed two contrasting views of the economy. That was again the case today.
As in last month, residential construction spending increased for the month. Below I show it in comparison with single family permits:
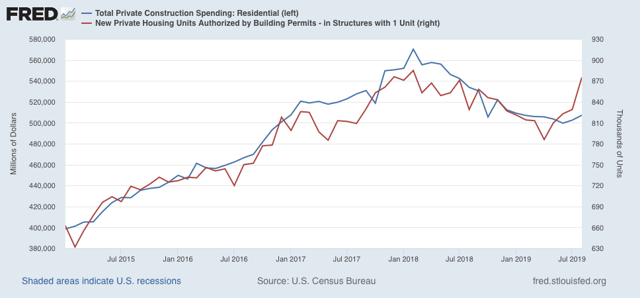
As in last month, residential construction spending increased for the month. Below I show it in comparison with single family permits:
Typically construction follows permits. In the past few years, it has been almost coincident with permits. In any event, this is more confirming evidence that in the important and leading housing sector, the decline that started in early 2018 has ended. This is positive news for the economy as a whole in 2020.
But once again the ISM manufacturing index was bad news, falling further below 50 from 49.1 in August to 47.8 in September. Just as badly, the leading new orders component, which one month ago had the worst reading since the Great Recession, at 47.2, barely improved this month to 47.3:
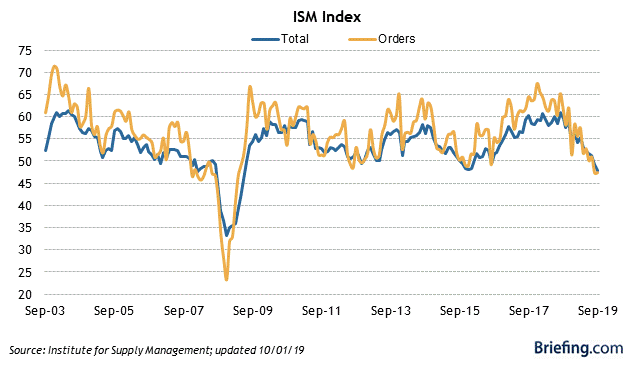
In the past it has typically taken at least two readings below 48 for the ISM manufacturing index to indicate recession. On the other hand, the new orders index is already at a level which has been consistent over the past 70 years with a recession in the very near future - although it is also consistent, as for example in 1966, with a slowdown only:
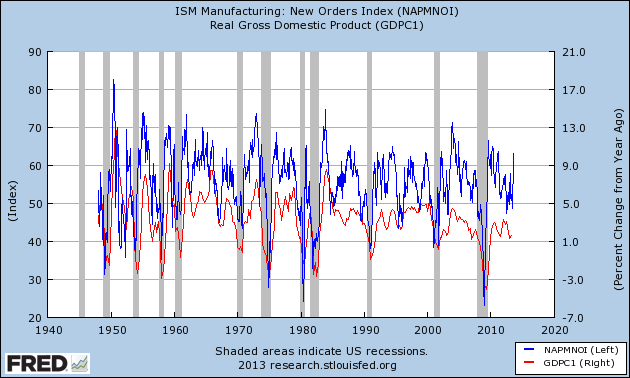
I should caution that the manufacturing sector in the economy is a smaller segment now than at any point since these series were started almost 75 years ago, so that a downturn there — and there certainly is a downturn there now — will have less repercussions than in the past. Which is a more long-winded way of saying that I think the economy as a whole is more likely to see a slowdown than an outright contraction.
Exactly as in one month ago, the reports, combined, suggest that in Friday’s jobs report there should be a little improvement in residential construction jobs, but suggest a decline in manufacturing jobs (last month there was a very slight increase) -- something that has been loudly telegraphed by the decline in the manufacturing work week in the past year.
Monday, September 30, 2019
Weekly Indicators for September 23 - 27 at Seeking Alpha
- by New Deal democrat
My Weekly Indicators post is up at Seeking Alpha.
If you’re wondering why it’s so late, it’s because SA pretty much shut down between Friday afternoon and this morning.
Anyway, recession risks are rapidly receding, at least through the 4th Quarter. As usual, clicking over and reading puts a little jingle in my pocket, as well as brining you up to the moment on the economy.
Subscribe to:
Posts (Atom)