Saturday, July 14, 2012
Weekly Indicators: widespread weakness, mixed signals edition
- by New Deal democrat
Monthly data reported last week was sparce. Consumer confidence continued to slide. The PPI unexpectedly rose slightly, while import and export prices both fell. Consumer credit increased.
As to the high frequency weekly indicators, let's start with the jobs-related numbers.
Employment related indicators were mixed:
The Department of Labor reported that Initial jobless claims fell 24,000 from the prior week's unrevised 374,000 to 350,000 last week. The four week average fell 8750 to 376,500. This is the best showing in jobless claims in over 4 years. There may be a distortion due to auto plants not closing for retooling, but even that "distortion" sounds like a positive reason.
The Daily Treasury Statement for the first 8 reporting days of July was $62.4 B vs. $63.2 B a year ago. For the last 20 days ending July 12, $137.4B was collected vs. $135.4B for the same period in 2011, an increase of $2.0 B, or +1.5%. This is very weak but should probably be averaged with last week's 30 day average of +10%, due to the impact of the July 4 holiday.
The American Staffing Association Index remained at 93. for the third week in a row. This index has been generally flat for the last two months, mirroring its 2nd quarter flatness last year. Despite that, due to the July 4 artifact it is enow equal to its all time high for this week of the year.
Rail traffic turned mixed once again:
The American Association of Railroads reported a +1.4% increase in total traffic YoY, or +7,200 cars. Non-intermodal rail carloads were down -1.0% YoY or -2500, as coal hauling again fell YoY. Without coal, as has become usual, the change would have been positive. Intermodal traffic was up 10,800 or 5.6% YoY. Negative comparisons, however, have spread to 13 of the 20 carload types, the worst showing since the recovery began. The spreading of weakness in rail hauling is now a real red flag.
Same Store Sales were decidedly mixed.
The ICSC reported that same store sales for the week ending July 7 were up 0.2% w/w, and were up +3.0% YoY. Johnson Redbook reported a 2.0% YoY gain. Shoppertrak, which has been very erratic, reported a +10.8% YoY gain! The 14 day average of Gallup daily consumer spending at $72, however, was only equal with last year's rate. This is the fourth week in a row in which consumer spending has weakened significantly, barely if at all improving YoY, at least in the Gallup report.
Housing reports were mixed:
The Mortgage Bankers' Association reported that the seasonally adjusted Purchase Index rose 3% from the week prior, but was down approximately 3% YoY, back into the middle part of its two year range. The Refinance Index fell3%, but it still near its 3 year high set three weeks ago.
The Federal Reserve Bank's weekly H8 report of real estate loans this week fell -0.2%, and the YoY comparison decreased to +0.9%. On a seasonally adjusted basis, these bottomed in September and remain up +1.0%. The YoY growth rate has generally weakened in the last month.
YoY weekly median asking house prices from 54 metropolitan areas at Housing Tracker were up + 2.3% from a year ago. YoY asking prices have been positive for 7 1/2 months, and remain higher than at any point last year.
Money supply was also weakly positive and is now being compared with the inflow tsunami of one year ago:
M1 rose +1.0% last week, and was up +0.5% month over month. Its YoY growth rate declined to +14.5%, so Real M1 is up 12.8%. YoY. M2 rose +0.4% for the week, and was up 0.7% month/month. Its YoY growth fell again to 8.5%, so Real M2 grew at +6.8%. Real money supply indicators after slowing earlier this year, have increased again, but YoY comparisons are starting to wane as expected.
Bond prices were mixed and credit spreads increased:
Weekly BAA commercial bond rates increased by .03% to 5.03%. With the exception of one week, these are the lowest yields in over 45 years. Yields on 10 year treasury bonds fell .03% to 1.61%. The credit spread between the two rose again to 3.42%, back at its 52 week low set three weeks ago. The recent collapse in government bond yields shows fear of deflation due to economic weakness. Corporate yields rising in the face of this weakness, if continuing, is a sign of recession.
The energy choke collar remains disengaged:
Gasoline prices rose last week after falling for eleven straight week, up .05 to $3.41. Oil prices per barrel rose another $3, closing Friday at $87.07. Oil prices remain well below the point where they start to constrict the economy, and gasoline has followed. The 4 week average of Gasoline usage, at 8917 M gallons vs. 9016 M a year ago, was off only -1.1%. The 4 week average at 8864 M vs. 9226 M one year ago is off -3.9%, still a significant YoY decline; however, June and early July of 2011 were the only months after March 2011 where there was a YoY increase in usage, so the YoY comparison now is especially difficult. For the last two weeks, however, there is been very little change in YoY demand, which is a definite improvement.
Turning now to high frequency indicators for the global economy:
The TED spread fell .02 to 0.37. During the week it made a new 52 week low. The one month LIBOR rose .02 to 0.248. It has now risen significantly above its recent 4 month range, it remains well below its 2010 peak, and has still within its typical background reading of the last 3 years. Even with the recent scandal surrounding LIBOR, it is probably still useful in terms of whether it is rising or falling.
The Baltic Dry Index fell 47 to 1110. It is 440 points above its February 52 week low of 670, although well below its October 2011 peak near 2200. The Harpex Shipping Index fell for the sixth straight week from 435 to 430, but is still up 55 from its February low of 375.
Finally, the JoC ECRI industrial commodities index fell from 117.78 to 116.13. This is still near its 52 week low. Its recent 10%+ downturn during the last few months remains a strong sign of all that the globe taken as a whole is slipping back into recession.
To reiterate my conclusion from one week ago, weakness has grown widespread, although most indicators are still positive. In addition to the diffusion of negative YoY rail carloads, credit spreads are now at a 52 week low. Global figures continue to suggest that the US is the least bad global economy, and that the world economy as a whole may be contracting at least slightly.
Have a nice weekend!
Friday, July 13, 2012


The ECB's Policy Bind
I don't envy the ECB. First, they have to set interest rate policy for a host of countries in a variety of economic positions. For example, over the last year, their policy impact was felt in countries that were doing fairly well (Germany) and countries that were falling apart (Greece). These are not ideal conditions from which to operate monetary policy.
That being said, there are legitimate questions about the ECB's most recent actions. For example, last week the ECB lowered interest rates. Why they didn't do this earlier has perplexed several commentators, largely because the situation in the EU has grown more dire over the same period -- and this was against a backdrop of increasing negativity caused by the Greek situation. In the ECB's defense, I would add that they may have been waiting to act for a more dramatic time, largely because there is really very little more they can do from an interest rate perspective.
But, all that being said, the poor situation in the EU has been known for some time. Consider the following from the latest EU economic bulletin:
More importantly, consider this chart of GDP:

The blue line represents quarter to quarter GDP grown. By the fourth quarter of 2011, it was obvious that overall growth was trending lower. More importantly, notice that domestic demand (the blue area in the columns) was negative in the second and fourth quarter of 2011 and just barely positive in the third quarter. In addition, this number went negative in the first quarter of 2012.
 In addition, consider the chart above of total retail sales. The trend has been consistently dropping since the end of 2010. This would add fuel to the above comments.
However, in the ECBs defense, there is this:
Inflationary pressures were heating up in the EU area over this time, largely due to the increase in oil prices. At this point, we need to ask an important question: should the ECB have allowed its inflation targets and policy preference rise in order to allow them more latitude in interest rate policy (and central bank policy in general)? There is no easy answer to this question. Most central bankers would argue that their "inflation fighter" stance has been hard won, and any compromise in that position would hurt their market credibility. Others would argue that these are extraordinary times requiring extraordinary action.

The above chart of the overall EU inflation rate shows that it was rising from 2010 to mid-2011 when it leveled off and started moving lower. However, it was still at levels that would make a central banker uncomfortable. From their perspective, they're thinking that 3% can easily morph into 4.5%, at which time containment is far more difficult -- especially as that may lead to a degradation of the market's confidence in the ECB to fight inflation.
The point of the above discussion is to highlight that being a central banker is an extraordinarily difficult job with no easy answers or clear policy directions.
That being said, there are legitimate questions about the ECB's most recent actions. For example, last week the ECB lowered interest rates. Why they didn't do this earlier has perplexed several commentators, largely because the situation in the EU has grown more dire over the same period -- and this was against a backdrop of increasing negativity caused by the Greek situation. In the ECB's defense, I would add that they may have been waiting to act for a more dramatic time, largely because there is really very little more they can do from an interest rate perspective.
But, all that being said, the poor situation in the EU has been known for some time. Consider the following from the latest EU economic bulletin:
On a quarterly basis, euro area real GDP growth was fl at in the first quarter of 2012. Available indicators for the second quarter of the year point to a weakening of growth and highlight prevailing uncertainty. Looking beyond the short term, the euro area economy is still expected to recover gradually. However, ongoing tensions in some euro area sovereign debt markets and their impact on credit conditions, the process of balance sheet adjustment in the financial and non-financial sectors and high unemployment are expected to continue to dampen the underlying growth momentum. The June 2012 Eurosystem staff macroeconomic projections for the euro area foresee annual real GDP growth ranging between -0.5% and 0.3% in 2012 and between 0.0% and 2.0% in 2013. Compared with the March 2012 ECB staff macroeconomic projections, the range predicted for 2012 remains unchanged, while there is a slight narrowing of the range predicted for 2013. The economic outlook for the euro area is subject to increased downside risks.
More importantly, consider this chart of GDP:

The blue line represents quarter to quarter GDP grown. By the fourth quarter of 2011, it was obvious that overall growth was trending lower. More importantly, notice that domestic demand (the blue area in the columns) was negative in the second and fourth quarter of 2011 and just barely positive in the third quarter. In addition, this number went negative in the first quarter of 2012.

However, in the ECBs defense, there is this:
The sluggish developments in consumption largely refl ect movements in real income, which is among the main determinants of consumer spending trends. Growth in aggregate real income started to decline in the course of 2011, on the back of weaker employment growth, and was further eroded by rising inflation. Household income in real terms declined year on year in the fourth quarter of 2011 for the second consecutive quarter. This, combined with continued elevated inflation, renewed uncertainty regarding the economic outlook and fiscal retrenchment, led to the household savings ratio rebounding somewhat from near pre-crisis lows.
Inflationary pressures were heating up in the EU area over this time, largely due to the increase in oil prices. At this point, we need to ask an important question: should the ECB have allowed its inflation targets and policy preference rise in order to allow them more latitude in interest rate policy (and central bank policy in general)? There is no easy answer to this question. Most central bankers would argue that their "inflation fighter" stance has been hard won, and any compromise in that position would hurt their market credibility. Others would argue that these are extraordinary times requiring extraordinary action.

The above chart of the overall EU inflation rate shows that it was rising from 2010 to mid-2011 when it leveled off and started moving lower. However, it was still at levels that would make a central banker uncomfortable. From their perspective, they're thinking that 3% can easily morph into 4.5%, at which time containment is far more difficult -- especially as that may lead to a degradation of the market's confidence in the ECB to fight inflation.
The point of the above discussion is to highlight that being a central banker is an extraordinarily difficult job with no easy answers or clear policy directions.
Morning Market Analysis


When looking at the US markets, notice that two of the major averages (the QQQs and SPYs) are now below support. Ideally, the next strongest level of support for all of these is the 200 day EMA.


The German (top chart), Japanese (middle chart) and UK chart (bottom chart) markets are all three in the middle of a rising, counter-trend chart on the weekly chart. Notice the declining volume on the German and UK charts; this is a clear sign of a weakening counter-rally. Also note the weak momentum reading and declining CMF, indicating money is leaving the market. The most likely direction for these markets is lower.
Thursday, July 12, 2012
The Bank of England's Policy Minutes
Last week, the Bank of England release the policy minutes for their June 22 meeting. It's wonderful that these types of records are released sooner now, as it allows us to get into the mind of the central bank. It's also good to see a calmer and reasoned discussion about the overall economic situation -- one that is removed from the 24 news cycle.
This is really proverbial icing on the cake of the problem. Over the last six months, we're seen a continued deterioration in the growth prospects of several regions of the world. A world wide credit event -- on top of an economic slowdown -- would lead to a very bad situation.
The above paragraphs highlight the overall macroeconomic environment very well, and clearly explain the overall problems faced by all policy makers.
The outlook for financial stability had deteriorated, particularly in light of heightened uncertainty about how, and when, euro-area risks would be resolved. Official policy measures, including the ECB’s longer-term refinancing operations (LTRO), had led to improved bank funding conditions and reduced market volatility in 2012 Q1. But underlying concerns about sovereign indebtedness, banking sector resilience and imbalances across the euro area had persisted and the improvement in sentiment had proved temporary. For example, spreads on Spanish sovereign debt relative to German bunds had increased to historically high levels and bond yields of several other euro-area governments remained elevated and volatile.Nothing we don't already know, but a good overview of the last 6 months. At the end of the last year, the ECB opened up a massive credit facility. This stabilized the financial markets for some time, as it gave market participants hope that a "floor" of sorts was being set under the market. However, the overall financial situation in the EU region continued to deteriorate, largely because more countries (Italy and Spain) saw their respective bond yields increase to unsustainable levels.
Market strains had re-emerged reflecting rising financial distress and political tension in the euro area, particularly regarding Greece and concerns that the country might require further debt restructuring and/or leave the euro area. A number of developments had reinforced perceptions of strong links between the creditworthiness of European sovereigns and euro-area banks, such as the efforts of the Spanish authorities to recapitalise the Spanish banking sector. Increasing concerns about sovereign balance sheets had manifested themselves in a sustained redistribution of international capital, with growing evidence of capital flight from some euro-area banks and capital markets and a reluctance byinvestors to hold some euro-area assets.
The Committee noted that major UK banks’ exposures to the most vulnerable euro-area economies’ sovereigns and banks were not high, totalling 6% and 14% of core Tier 1 capital respectively. But UK banks had significantly larger exposures to private sector borrowers in many of these countries. And, although some banks had made sizeable provisions, the risk of further significant losses persisted while the macroeconomic backdrop remained adverse. BanksI believe this is the real concern many central bankers have: another large and wide-spread credit event which would essentially freeze the financial intermediary system of the region. This would almost always lead to a recession, as credit would essentially dry up. However, considering the precarious nature of the overall economic situation right now, such a development would be disastrous.
in other EU countries were also exposed to vulnerable euro-area countries, leading to the potential for indirect losses for UK banks. If contagion were to spread, there would likely be significant disruption through secondary channels, such as increased counterparty risk and stresses in funding markets, with adverse feedbacks to the macroeconomy
These concerns prevailed against a backdrop of deteriorating global growth prospects. In particular, some larger emerging economies had experienced rapid credit growth and there were signs of overvaluation in some Asian property markets. A disorderly unwinding of asset prices could result in direct losses on UK-owned banks’ exposures to the region, which for some banks were significant
This is really proverbial icing on the cake of the problem. Over the last six months, we're seen a continued deterioration in the growth prospects of several regions of the world. A world wide credit event -- on top of an economic slowdown -- would lead to a very bad situation.
The above paragraphs highlight the overall macroeconomic environment very well, and clearly explain the overall problems faced by all policy makers.
Grain Prices Are No Longer Contained
Over the last few weeks, we've seen a continued heat wave across the US' bread belt. As a result, the USDA recently downgraded the current US grain crop, leading to a massive spike in the grain complex. Consider the following charts:


Morning Market Analysis

The weekly gold chart continues to move sideways. Although momentum is decreasing, it's not a strong downward move. Remember, there is just enough buying interest still, caused by global instability. For this chart to make a convincing move lower, we'd have to see a strong move below the 150 level.

Copper broke an uptrend at the end of the spring, and has since traded in a fairly tight range between 42 and 44. However, prices are still below the 200 week EMA, and the shorter EMAs are moving lower as well. The MACD reading is mixed; it is in negative territory, but is about to give a buy signal. However, the CMF tells us that money is leaving the market.

The weekly transports are moderately encouraging. They are trending lower, but at a very slow rate. In addition, the shorter EMAs are rising (although they're bunched together very tightly). In addition, momentum is decreasing and the CMF reading is positive (but low). The key to this chart is the 50 week EMA; so long as that holds, we're OK.

Note that consumer staples are in the middle of a multi-year rally.
Wednesday, July 11, 2012
Bonddad Linkfest
- A really good summation of the LIBOR scandal (Economist)
- Fed officials hint at further easing (Marketwatch)
- Job openings increase (Marketwatch)
- German inflation slows (German Statistics Bureau)
- Seven factors to watch in a slowing economy (Big Picture)
- China to boost investment stimulus (BB)
- Emerging market index falls to two week low (BB)
- Corporate bonds are attracting bidders (BB)
- Emerging markets are slowing (BB)
US Slashes Corn Production Estimates
This is a huge downward revision -- and a very big deal in agricultural land:
The worst drought in the US in 25 years has wrought havoc on the country’s most important crops, putting the global economy at risk of its third food inflation shock in five years.
The US Department of Agriculture on Wednesday slashed its forecast for the corn crop by the most since the drought of 1988, cutting its 2012-13 production estimate by 12 per cent and its season-end inventory estimate by a hefty 37 per cent.
The US is the world’s largest corn exporter and is a key supplier of other food commodities including soyabean and wheat. The USDA monthly estimates are among the most closely monitored barometers of food commodities markets.
\The much lower-than-expected size of the US crops sent the price of corn and soyabean higher, reviving memories of the price jump in 2007-08 during the food crisis and the surge in 2010-11 after Russia banned exports of grains.
However, policymakers do not believe the world is facing a new food crisis because the global supply of wheat and rice, the two commodities most important for the world’s food security, remain relatively plentiful and prices are still below previous highs.
Initial claims and unemployment: an update
- by New Deal democrat
In view of the last few weeks' initial jobless claims numbers, and yet another weak jobs report last Friday, let's take another look at a few series I've noted previously.
First of all, there's been a theory that seasonality since the great recession has been distorted, causing the first quarter's numbers to be unusually good, and the second quarter's unusually bad. Here's initial claims since January 2011, showing the second quarter bump last year and again this year:
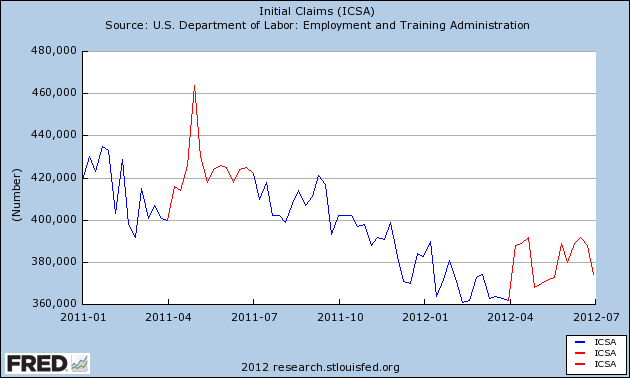
The bump this year, if anything, looks slightly less than last year's. On the other hand, beginning the second week of July, the bump ceased. That's exactly the week we are at now, so if this is just a quirk of seasonality, we should see the initial claims number stay under 380,000 starting with tomorrow's report.
This next graph looks at the same data, but pace Karl Smith, measures YoY change in the absolute number of weekly claims:
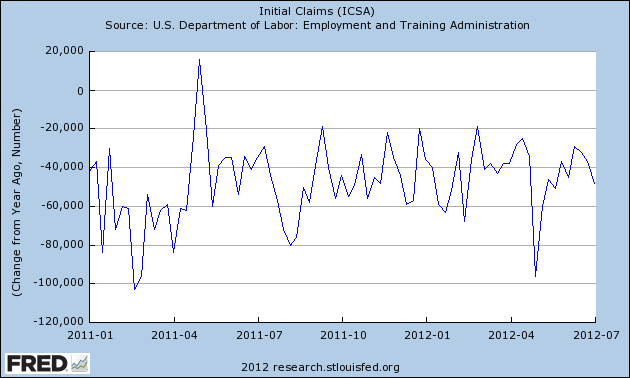
What this tells us is that the YoY trend, week by week, is intact. In other words, so far, so good.
Next, here's a graph of temporary employment. Temporary employment is generally considered a leading indicator, meaning this number will turn south before the overall jobs report will:
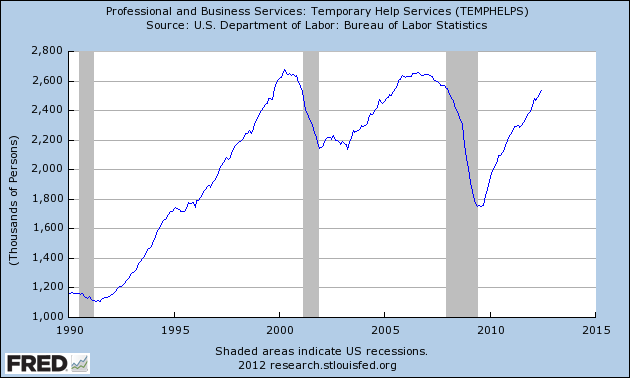
Once again, the upward trend is intact.
Next. let's look at the JOLTS hiring index. You may recall that I suggested this may be a good leading indicator, under the theory that hiring leads firing, although the data sample is small:
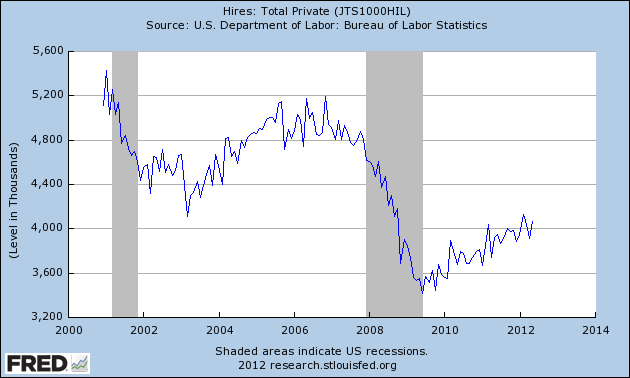
Again, the upward trend is intact.
Finally, under the same theory that hiring leads firing, Prof. Geoffrey Moore, the founder of ECRI, considered unemployment of zero to 5 weeks a longer leading indicator than initial jobless claims. Here the picture isn't good at all:
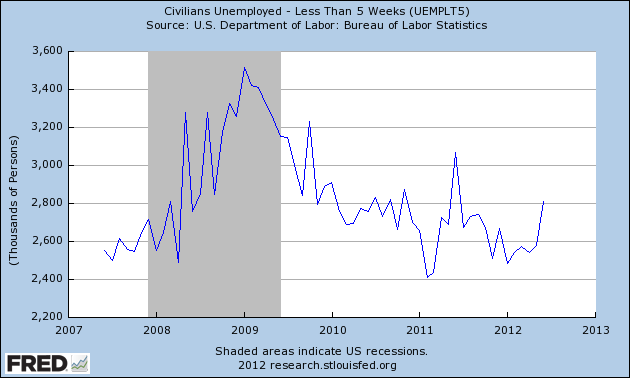
This number has risen more than 300,000 above its recovery lows. In the past, that has been consistent with, although not necessarily a prelude to, a new recession.
In summary, most of the indicators look positive, although we certainly want to start to see continued improvement in the initial claims numbers.
Morning Market Analysis

The Brazilian market is still bottoming. The market dropped about 28.5% from the beginning of March to the end of May, but is now moving sideways. The 10 and 20 day EMA are moving sideways, but the longer EMAs are still trending lower. Momentum is increasing, but the overall reading is still negative. For a move higher to be "real," we'd need to see a move above the 50 day EMA.

The Russian market had a fall as sharp as that of Brazil -- moving from a bit over 33 to 23 over a three month period. However, now prices are in a nice uptrend. In addition, the shorter EMAs are moving higher and are about to cross the 50 day EMA. Prices have already advanced above the 50 day EMA once. Momentum has crossed into positive territory and money is moving into the market.

The Indian market is a mirror impact of the Russian market, although prices are in better shape as they are above the 50 day EMA. Also note the improving EMA picture; the shorter EMAs are rising, the 10 day EMA has crossed the 50 day EMA and the 50 is now moving higher. This chart indicates traders think India will rebound from its recent weakness.

The Chinese market is directly parallel to the Brazilian market; prices have fallen and are now moving sideways.
The Russian and Indian markets are sending encouraging -- albeit it early -- signals. However, in an ideal world, we'd see China and Brazil move higher as well. China is getting hit with all the negative news of late, while Brazil is close to 0% growth. Put another way, the fundamental picture in both those countries is holding back a market rebound.
Tuesday, July 10, 2012
Bonddad Linkfest
- Overall race still neck and neck (WaPo)
- Obama camp pushed Romney on tax return disclosure (NYT)
- Dire outlook for crop conditions (AgWeb)
- Corn crop on verge of a disaster (AgWeb)
- US Drought sends soy beans to record price (FT)
- Canadian business survey (Bank of Canada)
- US consumer credit (FRB)
- Chinese imports drop (BB)
- UK manufacturing increases (BB)
- France issues short-term paper at negative yields (FT)
US Crops Hit By Massive Downgrade
From Agrimoney:
Corn deterioration heralds 'huge yield downgrade'
further sharp decline in the condition of US crops, which showed particular deterioration in the top corn and soybean growing state, has opened the door to a "massive yield downgrade" in a key report.
The US Department of Agriculture, in a weekly crop condition report, cut by eight points to 40% the proportion of domestic corn in "good" or "excellent" condition as of Sunday, the lowest figure since the drought year of 1988.
The proportion of soybeans rated good or excellent tumbled by five points to 40%, also a 24-year low, thanks to the hot and dry Midwest weather which has dashed hopes of bumper crops, and sent grain prices soaring.
'Massive yield downgrade'
Indeed, the run-up in soybean futures to a record high on Monday, and corn futures to within 2% of their own all-time top, came on "expectations that the USDA would reduce their US crop condition ratings after the session closed", Luke Mathews, at Commonwealth Bank of Australia, said.
"And the USDA did not disappoint. The deterioration in crop conditions paves the way for a massive yield downgrade by the USDA" when it on Wednesday releases the latest edition of its monthly Wasde crop report, key features of the agricultural commodities calendar.
"We think the USDA will cut corn yields to 150-153 bushels per acre," from a current estimate of 166 bushels per acre, Mr Mathews said.
A downgrade of that level would equate to some 1.2bn-1.4bn bushels (29m-36m) tonnes of corn production, factoring in the official forecast for harvested corn acres of 88.9m acres.
Commerzbank said: "Radical cuts in the yield and crop forecasts by the USDA tomorrow are inevitable."
More Evidence of A Housing Turnaround
Consider the following statements from various housing companies and their respective latest financial disclosure statements.
From Ryland's latest 10-Q, for 3/31/13
From Ryland's latest 10-Q, for 3/31/13
The Company consists of six operating business segments: four geographically-determined homebuilding regions; financial services; and corporate. All of the Company’s business is conducted and located in the United States. The Company’s operations span all significant aspects of the homebuying process—from design, construction and sale to mortgage origination, title insurance, escrow and insurance services. The homebuilding operations are, by far, the most substantial part of its business, comprising approximately 97 percent of consolidated revenues for the quarter ended March 31, 2012. The homebuilding segments generate nearly all of their revenues from sales of completed homes, with a lesser amount from sales of land and lots.
During the first quarter of 2012, attractive housing affordability levels; modest improvement in economic and unemployment indicators; and moderate changes in buyer perceptions appear to have enhanced the Company’s ability to attract qualified homebuyers. New home prices appear to have stabilized; required sales incentives have continued to decline in most markets; average sales traffic through the Company’s communities has increased; sales rates have risen noticeably; and cancellation rates have decreased. The Company has begun to raise prices in selective markets and has reported an increase in sales volume for the quarter. These trends may be early signs that new housing markets have begun to improve. An uncertain macroeconomic environment; tight mortgage credit standards and mortgage availability; and a large inventory of lender-controlled homes acquired through foreclosure continued to impact the homebuilding industry by keeping sales absorptions per community depressed, compared to traditional levels. The Company continues to believe that meaningful advances in revenue growth and financial performance will primarily come from higher demand in the form of a return to more traditional absorption rates.The Company’s net loss from continuing operations totaled $3.0 million, or $0.07 per diluted share, for the three months ended March 31, 2012, compared to a net loss from continuing operations of $17.4 million, or $0.39 per diluted share, for the same period in 2011. The decrease in net loss for the first quarter of 2012, compared to the same period in 2011, was primarily due to higher closing volume; lower inventory valuation adjustments; a decline in interest expense; and a reduced selling, general and administrative expense ratio. Pretax charges related to inventory and other valuation adjustments and write-offs totaled $2.1 million and $9.1 million for the quarters ended March 31, 2012 and 2011, respectively. In spite of reporting a net loss, the Company continued its progress toward profitability by raising gross margins through continued investments in new, more profitable communities; completing less desirable communities; and lowering expense ratios.The Company reported a rise in closing volume for the quarter ended March 31, 2012, compared to the same period in 2011, primarily due to increases in sales rates and active communities. The Company’s consolidated revenues increased 28.7 percent to $215.9 million for the three months ended March 31, 2012, from $167.7 million for the same period in 2011. This increase was primarily attributable to a 25.4 percent rise in closings and to a 3.2 percent increase in average closing price. The increase in average closing price was due to a slightly more stable price environment, as well as to a change in the product and geography mix of homes delivered during the first quarter of 2012, versus the same period in 2011. Revenues for the homebuilding and financial services segments were $209.5 million and $6.3 million, respectively, for the first quarter of 2012, compared to $161.4 million and $6.2 million, respectively, for the same period in 2011.New orders rose 46.4 percent to 1,328 units for the quarter ended March 31, 2012, from 907 units for the same period in 2011, primarily due to increases in sales rates and active communities. New order dollars increased 51.8 percent for the quarter ended March 31, 2012, compared to the same period in 2011. The Company’s average monthly sales absorption rate was 2.1 homes per community for the first quarter of 2012, versus 1.5 homes per community for the first quarter of 2011. In order to prepare for a slow recovery and to attain volume levels
Granted, this is for the quarter ended March 31; I would expect a slowing of sorts for the second quarter 2012. However, the overall tenor of this report is positive; sales traffic is increasing as are prices; revenues increased and sales incentives are declining.
“Evidence from the field suggests that the 'for sale' housing market has, in fact, bottomed and that we have commenced a slow and steady recovery process. And while the housing downturn was broad-based and national, the recovery process continues to be very localized. Although highly conservative mortgage lending practices and challenging appraisals remain a constant headwind, we are experiencing net positive price and volume trends in most of our markets.”
Mr. Miller continued, “As the overall housing market has continued to improve over the last several quarters, our well located communities and product execution has allowed us to outperform the market. During the quarter, deliveries increased 20%, new orders increased 40%, backlog increased 61% and our operating margin increased over 100% to 9.2%, our highest margin percentage since Q2 2006. This operating leverage was driven by our ability to increase sales per community, raise prices and lower incentives, and control our overhead costs.”“During the quarter, we reversed a portion of the valuation allowance against our deferred tax assets amounting to $403 million. This conclusion was based on an extremely detailed evaluation by our management team and reviewed by our independent auditors, Deloitte & Touche. The evaluation consisted of all relevant evidence, both positive and negative, including such factors as nine consecutive quarters of earnings, the expectation of continued profitability, as well as the improved housing market.”Mr. Miller concluded, “Looking ahead, our strong balance sheet and significant liquidity, which was enhanced this quarter by our new $525 million unsecured revolving credit facility, continue to position us to capitalize on future strategic opportunities.”
Also consider these statements regarding the 2Q2012:
Revenues from home sales increased 23% in the second quarter of 2012 to $796.4 million from $649.8 million in 2011. Revenues were higher primarily due to a 20% increase in the number of home deliveries, excluding unconsolidated entities, and a 2% increase in the average sales price of homes delivered. New home deliveries, excluding unconsolidated entities, increased to 3,192 homes in the second quarter of 2012 from 2,652 homes last year. There was an increase in home deliveries in all the Company's Homebuilding segments and Homebuilding Other. The average sales price of homes delivered increased to $250,000 in the second quarter of 2012 from $245,000 in the same period last year. Sales incentives offered to homebuyers were $29,800 per home delivered in the second quarter of 2012, or 10.7% as a percentage of home sales revenue, compared to $33,900 per home delivered in the same period last year, or 12.1% as a percentage of home sales revenue, and $34,200 per home delivered in the first quarter of 2012, or 12.2% as a percentage of home sales revenue.
This paragraph is very similar to that reported by Ryland above.
In our second quarter of 2012, we continued to see an improving sales trend as the number and value of our net sales orders increased 19% and 28% compared to the same period of fiscal 2011. Consistent with fiscal 2011, we are seeing a demand pattern in our net sales during fiscal 2012 that is similar to the demand pattern we traditionally saw prior to the current housing downturn. The traditional demand pattern has the lowest net sales orders in our first fiscal quarter, a sequential increase from the first quarter to the second quarter, a consistent level in the third quarter and then slowing net sales orders in the fourth quarter. Our net sales orders for the current quarter increased 55% from the previous quarter, reflecting the expected seasonal increase as our spring selling season began. Our recent results and other national housing data suggest that the overall demand for new homes has slowly begun to improve, but we expect that demand is likely to remain at low levels for some time, with uneven improvement across our operating markets.
In the three and six months ended March 31, 2012, revenues from home sales increased 27% and 21% from the prior year periods and pre-tax income was $42.3 million and $71.5 million compared to pre-tax losses of $30.8 million and $50.7 million in the prior year periods. Based on our sales order backlog of 6,189 homes at March 31, 2012 and our current sales pace, we expect to close more homes in the second half of fiscal 2012 than in the first half, and we expect to continue generating pre-tax income. These results reflect our ability to operate profitably in a challenging environment through our strategy of investing capital to expand our operations, managing inventory levels efficiently, improving gross margins, and controlling SG&A and interest costs effectively
During the 2012 first quarter, we continued to focus on disciplined land acquisition to grow community count in the move-up segment, constructing well built, innovatively designed, and energy efficient homes, and providing an industry leading customer experience, all of which contributed to our first profitable first quarter in six years. Net income for the 2012 first quarter was $8.5 million, or $0.02 per diluted share, compared to a net loss of $14.8 million, or $0.04 per diluted share, in the first quarter of 2011. In addition, our number of average active selling communities, average selling prices, new home deliveries, net new orders and backlog levels increased during the 2012 first quarter compared to the year earlier period. While the housing market remains challenging, affordability in each of our geographic markets generally remains attractive relative to historical metrics. With over $366 million of unrestricted homebuilding cash and the additional amounts that remain available under our $210 million revolving credit facility, we believe we have ample liquidity to position the Company for future growth.
Homebuilding pretax income for the 2012 first quarter was $7.3 million compared to a pretax loss of $13.4 million in the year earlier period. The improvement in our financial performance was primarily the result of a 53% increase in home sale revenues and an $8.0 million decrease in interest expense. The 2012 first quarter also included $4.1 million of income related to the settlement of a property insurance claim.Home sale revenues increased 53%, from $143.7 million for the 2011 first quarter to $220.3 million for the 2012 first quarter, as a result of a 46% increase in new home deliveries and a 5% increase in our consolidated average home price to $343 thousand
Homebuilding revenues increased 17% for the first quarter of 2012 from the same period in 2011 primarily as a result of an 18% increase in the number of units settled. The increase in the number of units settled was primarily attributable to our beginning backlog units being approximately 26% higher entering the first quarter of 2012 as compared to the same period in 2011, offset partially by a lower backlog turnover rate quarter over quarter.
Gross profit margins in the quarter ended March 31, 2012 decreased 77 basis points compared to the first quarter of 2011 due primarily to pricing pressures experienced in prior quarters. In addition, gross profit margins were negatively impacted by higher construction costs quarter over quarter. We expect to continue to experience gross profit margin pressure over at least the next several quarters.The number of new orders and the average selling price of new orders for the first quarter of 2012 increased 31% and 6%, respectively, when compared to the first quarter of 2011. New orders were higher quarter over quarter in each of our market segments. The increase in new orders was driven by increased sales absorption in many of our markets. As discussed in the Overview section above, we believe this increase is attributable to a stabilization of housing prices in certain of our markets and other favorable economic factors. In addition, new orders in the current quarter were favorably impacted by a decrease in the cancellation rate to 10% from 12% in the prior year quarter.
Morning Market Analysis

The Brazilian real moved from about 21.50 to 17.75 from March to mid-May -- a drop of about 17.5%. Since than, prices have been moving sideways. Momentum is increasing, but is still negative, and the CMF just went negative. The low BB width reading tells us there isn't much volatility, either. Given the deteriorating economic situation in Brazil, it's doubtful we'll see a strong rally anytime soon.

The Australian dollar has increased from about 96.5 to about 102 -- a rise of about 5.7%. Momentum and volume are both positive as are the EMA readings. While Australia is slowing, it's still in better shape than most other economies, making the Australian dollar that much more attractive.
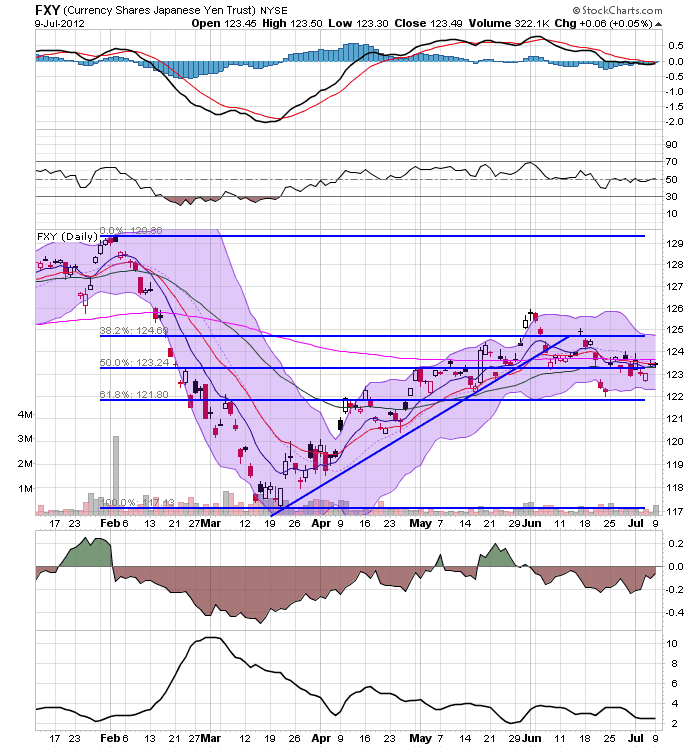
After rallying from mid-March to early June, the yen has been moving sideways, trading right at the 200 day EMA. Also note the other EMAs are tradiing right at the 200 day EMA. The currency is caught between safe haven status and overall Japanese economic weakness.

The euro is still in a bearish situation. After dropping in May, prices have been trading in a more or less sideways pattern. However, the overall EMA picture is still very negative, with all the shorter EMAs moving lower and prices far below the 200 day EMA. While the MACD is rising, it's still in negative territory. However, we are seeing some money flow in. This chart tells us that traders are still deeply concerned about the overall EU situation.

The Rupees overall position is similar to that of the real; after dropping from mid-February to June, prices have attempted to stabilize. The shorter EMAs (10 and 20( are now in neutral territory, although the longer EMAs are still bearish.
Monday, July 9, 2012
Bonddad Linkfest
- Obama's two-pronged economic problem (WaPo)
- Obama will ask for extension of Bush cuts (NYT)
- Japanese machinery orders decrease 14.5% in May (ESRI).
- Chinese inflation slows to 2.2% (FT)
- German export orders rebound (FT)
- French business asks for shock supply treatment (FT)
- German anti-euro backlash increases (Marketwatch)
- Dealers less likely to part with treasuries (BB)
- Hong Kong and Vietnam signal growth will slow (BB)
- BOJ fights deflation with aggressive policy (Sober Look)
CNN lies about Economists' support of Bush tax rates
- by New Deal democrat
The lead story on CNN's Money section as I write this is titled Economists: extend Bush tax cuts.
OMG! The scholars have repudiated the Democratic position! Whatever will we do?!?
For starters, expose the fact that CNN is lying -- CNN, did you hear me, LYING -- about the results of its own survey.
According to CNN,
In a CNNMoney survey that asked 15 economists to rank the impact of moves Congress could make to help the U.S. economy, nine endorsed some kind of extension of the Bush tax cuts.
But five of the economists wanted to extend the tax cuts for all taxpayers, while four endorsed the Obama administration's call to extend the cuts for all but those in the upper income tax bracket.
So, let's do a little second grade math, OK?
CNN surveyed 15 economists.
5 said extend all of the Bush tax cuts
+4 said extend the Bush tax cuts only for those earning less than $250,000
___
9 That's the sum when I was back in second grade.
That means, 6 economists were against any extension of the Bush tax cuts.
When I went to second grade 6 > 5 > 4.
That means that the plurality of economists did not want any extension of any of the Bush tax cuts. Two-thirds wanted at least some of the tax cuts to be terminated. Only 1/3 of all the economists wanted the Bush tax cuts extended in their entirety.
So CNN decided to embrace the 1/3 minority in its headline, ignoring that the majority of economists wanted some changes, and the largest number wanted the cuts to expire altogether.
Our liberal media at work.
Shadow Inventory Shrinking Quickly
From Sober Look At the Markets:
From Core Logic:
- As of April 2012, shadow inventory fell to 1.5 million units, or four-month’ supply and represented just over half of the 2.8 million properties currently seriously delinquent, in foreclosure or REO.
- The four-month’ supply of shadow inventory is at its lowest level in nearly three years. It parallels the unsold months’ supply of non-distressed active listings that hit a more than five-year low in April, falling to a 6.5-months’ from a 9.1-months’ supply just a year ago.
- Of the 1.5 million properties currently in the shadow inventory, 720,000 units are seriously delinquent (two months’ supply), 410,000 are in some stage of foreclosure (1.1-months’ supply) and 390,000 are already in REO (1.1-months’ supply).
- The dollar volume of shadow inventory was $246 billion as of April 2012, down from $270 billion a year ago and a three-year low.
- Serious delinquencies, which are the main driver of the shadow inventory, declined the most in Arizona (-37.0 percent), California (-28.0 percent), Nevada (-27.4 percent), Michigan (-23.7 percent) and Minnesota (-18.1 percent).
- .......
- It is important to note that the CoreLogic numbers exclude homes that are already listed in the market - it only shows the "shadow" (unlisted) inventory. That means that the overall inventory of distressed homes is far greater than the chart above shows (maybe 2 to 2.5 times that number).
Two key components are impacting the decline in shadow inventory:
1. A smaller portion of loan delinquencies now results in a sale due to the various loan restructuring programs and
2. the inventory has been hitting the market much faster than people anticipated.
Will Housing Save the Economy in the Second Half? Their Stocks Say Yes
Over the last few weeks, both NDD and I have weighed in on the housing market, arguing that we've put in a bottom and that we could see a big improvement in the second half. The stocks of this sector are starting to agree with that assessment. Let's start with the home building sector's etf, the XHBs:

The weekly chart shows that this sector rallied form its lows in the third quarter of 2011 to a high earlier this year. Prices have moved slightly lower since April, but this can be analyzed as a consolidation as much as a contraction. Prices used the 10, 20 and 50 week EMAs for technical support. Currently, prices are at/near multi-year highs.
In addition, the weekly charts of a large number of the stocks within the industry are incredibly strong. All of the charts below are at or near multi-year highs. All are above 200 the EMAs, with the shorter EMAs rising and bullishly aligned. Prices are strong and money is flowing into the markets.


This is not to say that all stocks in this area are doing well; they're not.

While Hovnanian has rallied over the last few months, prices are still nowhere near multi-year highs. But -- also note the price -- $2.94. This company is not in good financial shape period.

Comstock homebuilding is also trading in the same range its been trading in for the last two years. However -- note that this is a very cheap stock (less than $2.00/share), indicating the company is teetering on the financial brink.
Morning Market Analysis

The 5-minute QQQ chart shows an opening gap lower in Friday caused by the payrolls report. Prices continued to move lower until noon when prices stabilized. Prices moved sideways until 2:30 when we saw a small rally begin.

The 30 minute charts shows that prices were moving higher all last week until the payrolls report sent the market lower on Friday.


The chart of the three major averages is actually moderately encouraging. The IWMS spiked last week, before falling lower on Friday. However, as this is the risk based market, the upward move indicates traders may be looking at accepting a bit more risk in their portfolios. The QQQs and SPYs are also moving higher, although they are each doing so in a far more disciplined manner. The good news in these charts is the move higher, albeit at an incremental pace. I think the best description for the latest move is "grinding."


Last week I noted that the treasury yield curve was still rallying across maturities, indicating that the safety bid was still in play. The above charts of the corporate bond market show the exact same scenario: across the maturity spectrum, prices are still rallying, telling us traders/investors are reaching for safety.

The oil market rallied in response to the EU's financial announcement at the end of the preceding week. Prices continued their rally until they hit the 50 day EMA on Thursday. This was followed by the weak US employment report on Friday, which told traders that the world's largest oil consumer was still mired in weak growth. As a result, prices dropped to the 10 and 20 day EMA price levels.

After rallying in response to the EU situation in early May, The dollar has traded in a sideways pattern, moving between 22.4 and 23. The shorter EMAs tell us that prices have little momentum going forward.
Subscribe to:
Posts (Atom)