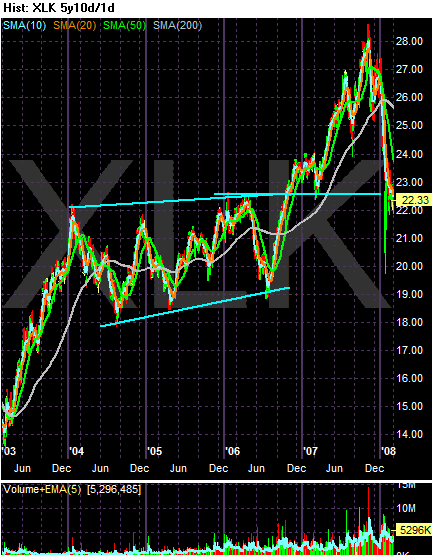
Notice the technology came late to this rally. It spent 2004 - 2006 consolidation in a trading range. However, it made up for lost time after it broke out of this range in 2006 with a strong rally that peaked at the end of 2007. However, the sector has since fallen 20% and is back to early 2006 levels.

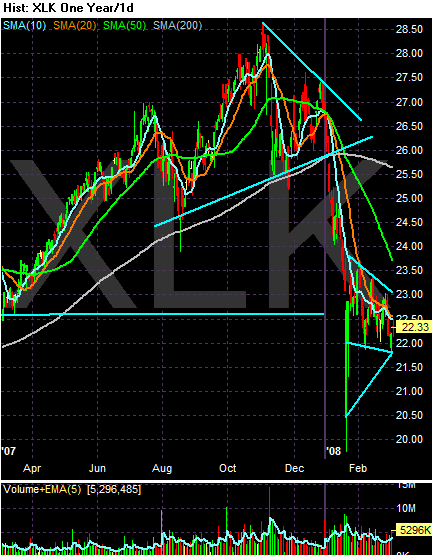
The yearly chart shows the index formed a triangle top in late 2007 but has since fallen. Also note that prices are currently in a downward sloping channel.

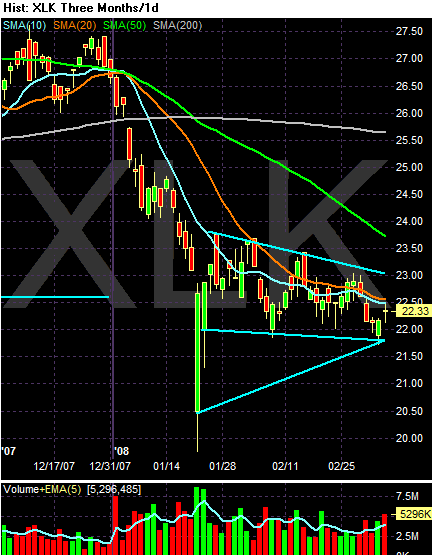
On the SMA (3 month) chart, notice the following:
-- Prices are below the 200 day SMA by about 12%.
-- The 50 day SMA is heading lower
-- Prices and the SMAs are tightly bunched right now.
-- Prices are in a slightly downward sloping downtrend right now.