- by New Deal democrat
As promised yesterday, today let me take an extended look at the important leading sector of housing. I want to walk through each of the important series generally in the order in which they have typically peaked, and how in at least one important respect this time is - somewhat - different.
First, here is another variation on a graph I have run many times, showing how mortgage rates (red) typically lead both total (dark blue) and single family (gold) permits and the more noisy starts (light blue). Here is 1972-98:
And here is 1999-present:
The magnitude of the response is not always proportionate (see the 1970s) and in at least one case (the housing bubble and bust of the 2000s) overwhelmed by other factors, but the relationship almost always holds.
Here is a close-up on the post-pandemic period:
As usual, not perfect, but the major leading/lagging relationship holds. Most importantly for today’s purposes, note that mortgage rates have not changed significantly in the past 20 months, and since then both permits and starts have become more rangebound YoY as well.
Next, let me show the relationship between new home sales (red) and permits, first from 1962 to 1994:
And 1995-present:
The point here is that sales lead even permits - but they are much more noisy (and also heavily revised), which is why I pay more attention to permits.
Here is the post-pandemic close-up, showing that as usual sales both peaked and troughed first, before permits, and have been similarly rangebound since mid-2023:
For completeness’ sake, here are purchase mortgage applications as well:
Unfortunately FRED is not allowed to publish these, but note that they peaked right after new homes sold and right before permits. They also troughed in late 2023, and were rangebound until the end of 2024, before rising in the early part of this year. That would normally be a good sign, but applications have declined again in the wake of the recent increase in mortgage rates due to Tariff-palooza!
Next, let’s delete the more noisy starts, and compare total and single family permits with housing units under construction (gold, right scale), all normed to their 2022 peaks:
The important points here are that units under construction - which as I almost always say, is the real total of the economic activity in this sector - follow permits (and starts) with a lag. And secondly that when there have been recessions, the number of units under construction continued to decline right into the period of actual economic contraction.
Once again, let’s focus on the post-pandemic period:
As usual, the number of units under construction followed permits by a little under a year. Note also that as per the above discussion of mortgage rates, the absolute number of permits has been rangebound for almost two years - until possibly yesterday’s report, which may have been the first one reflecting the impact of tariffs (on lumber, for example).
But more importantly, the number of units under construction has declined almost every month in the past 18, and is well within the range of declines where previously recessions have begun. Indeed, if units under construction stabilized for a significant period of time, that would suggest a recession has been avoided - but that has not happened.
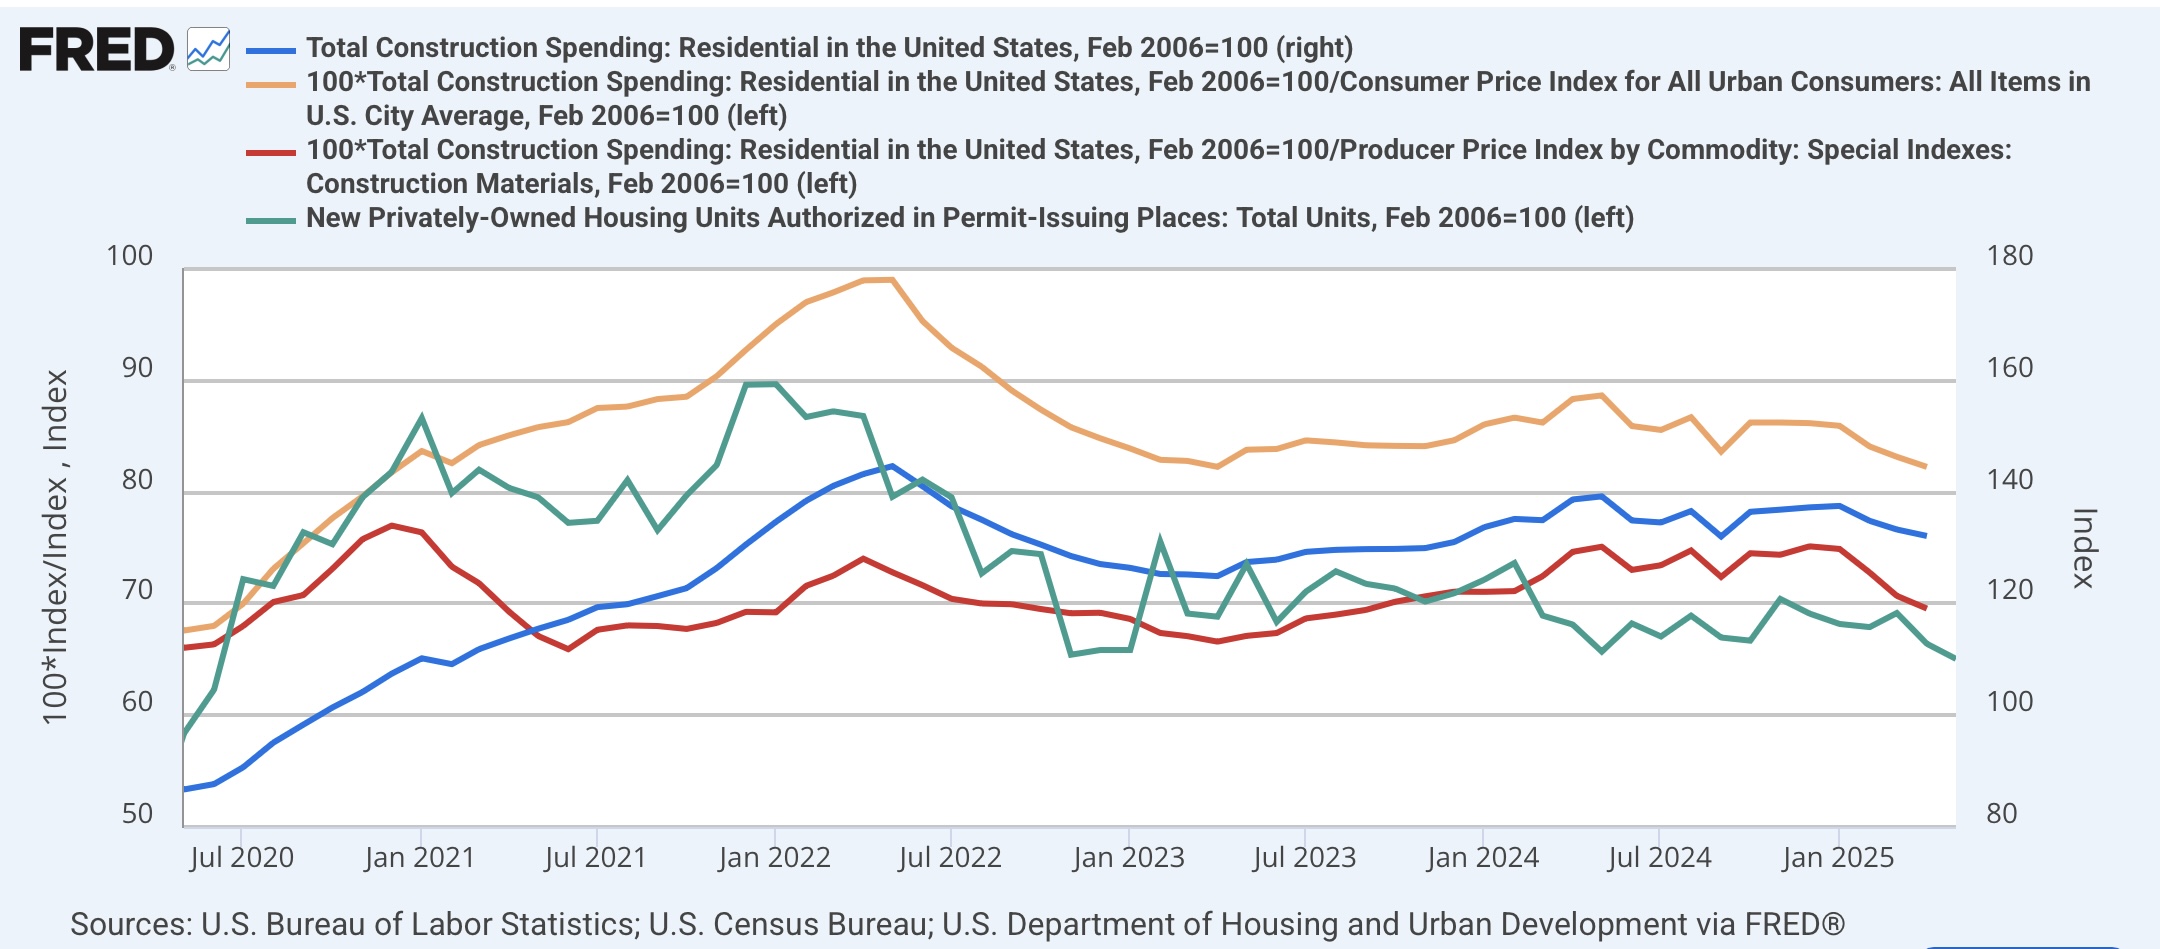
Before I get to the final series in chronological order, let me note that construction spending, whether nominal or adjusted for inflation, peaked almost simultaneously with permits in 2006:
Post-pandemic, as measured by construction costs, construction spending peaked at the time of the initial peak in permits in early 2001. Nominally or deflected by the CPI, it peaked several months before permits (teal) did in 2022:
Note that in the past several months residential construction spending has also declined further, just as permits have done.
Now let’s take a look at what the final shoes to drop typically have been before recessions have started, houses for sale (blue) and residential construction employment (red), in comparison with units under construction:
Although I won’t show a graph this time, remember that homes for sale lag homes sold in the housing sales report, and it has only been once homes for sale peak and then turn down that recessions have begun. There is no clear pattern as to whether homes for sale or residential construction employment peak first, but both lag units under construction.
And now, our final post-pandemic look:
The number of houses for sale declined slightly in April, but it is too soon to know whether that marks the peak or is just noise. But in the past 6 months, the number homes for sale have only increased by 1.2%. Residential construction employment is still increasing!
Let me make one final point about these last two graphs. At the outset of this post I wrote that at least one thing was somewhat different about this cycle, which has a lot to do with why the number of units under construction seemed to levitate for so many months after permits and starts peaked, and why employment in this sector has not turned down yet.
Notice, beginning in about 2012, how much construction employment lagged the increase in units under construction. Between then and the outset of the pandemic, units under construction nearly tripled, while the number of workers building those units only increased 50%. That has only been exacerbated since the pandemic, as units under construction peaked at more than *quadruple* their number in 2011, while employment in the sector is only up 70%.
With such a big decline in the number of laborers per unit being built, it is no wonder that the lag time has been so great, and the need to lay off workers so little. But if there is to be a recession, almost certainly both of the final shoes in this chronological panorama will drop first. And Tariff-palooza! might just do the trick.
[P.S.: Since there is no significant data tomorrow, and given the length of this post, don’t be surprised if I play hooky.]