Saturday, January 30, 2021

Weekly Indicators for January 25 - 29 at Seeking Alpha


 - by New Deal democrat

My Weekly Indicators post is up at Seeking Alpha.

After many weeks of stability, there is some turmoil - in opposing directions - among the short leading indicators in particular. It is an indication of the bifurcated nature of the economy at present, where portions of the service sector have a pandemic-sized hole blown in them, while  manufacturing is barreling ahead.

As usual, clicking over and reading will bring you up to the virtual moment, while putting a pittance in my pocket.


Friday, January 29, 2021

Real personal spending declines in December, while income rises; not quite enough to start a “double-dip” recession


 - by New Deal democrat

This morning’s report on personal income and spending for December reversed the pattern we have seen all during the second half of 2020. After rebounding strongly for 6 months, real personal spending (blue in the graph below) declined for the month by -0.2%, and is 3.6% below its February peak. Meanwhile real personal income (red), which has generally declined since April, rose 0.6%, and remains 1.3% higher than it was in February just before the pandemic hit:


The continued strength in income compared with prior to the pandemic has everything to do with the emergency stimulus Congress put in place early on after the pandemic hit. This has greatly ameliorated the privation which would otherwise have occurred.

Further, real personal income excluding transfer payments (I.e., payments from the government like food stamps and unemployment insurance) is one of the four coincident indicators which the NBER makes use of in determining if the economy is expanding or not. This also declined -0.2% in December, the second monthly decline in a row after increasing in the 6 prior months. In the below graph I show that (blue) together with jobs (red), real retail sales (green), and industrial production (gold) for the year 2020:


All four of these data points have been deteriorating since strong rebounds in May and June. Two (sales and income) were negative in November, and payrolls also went negative in December. Because industrial production is the King of Coincident Indicators, however, I doubt the NBER will mark a renewed recession beginning in either month. Still, *if* production rolls over, and the other three decline further in January, that might mean the start of a “double-dip.” But because I expect the pandemic to be brought somewhat under control by spring sometime, I further suspect that it won’t be enough to qualify as a renewed recession.

Thursday, January 28, 2021

Upward trend confirmed in new jobless claims


 - by New Deal democrat

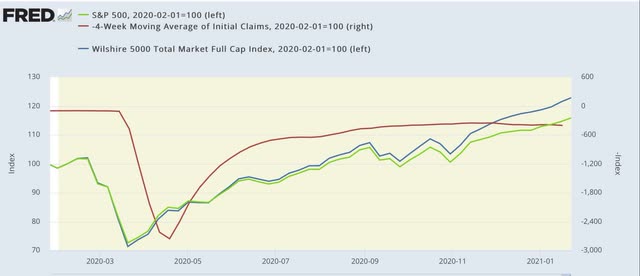
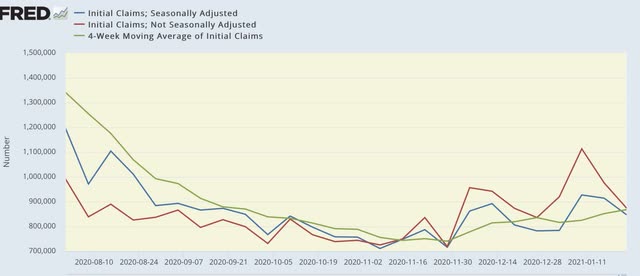
On a unadjusted basis, new jobless claims declined by 101,498 to 873,966. Seasonally adjusted claims also declined by 67,000 to 847,000. The 4 week moving average, however, rose by 16,250 to 868,000. Since the 4 week average has risen above 850,000, and weekly claims were above 900,000 for several weeks in a row, jobless claims have finally met my criteria confirming a change to an upward trend.

Here is the close up since the end of July (these numbers were in the range of 5 to 7 million at their worst in early April): 

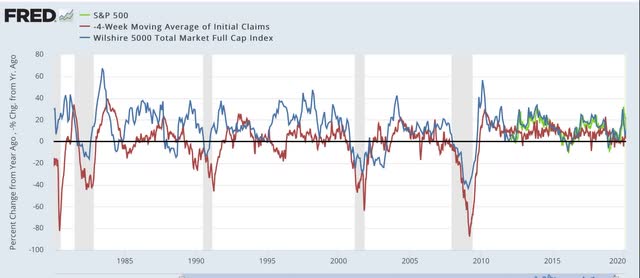
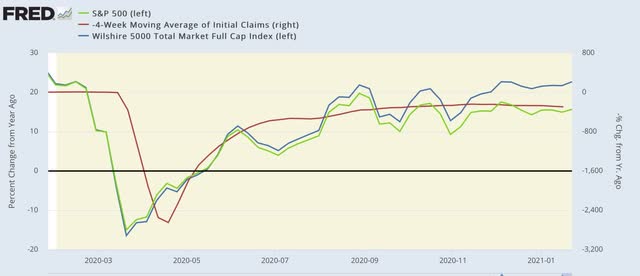
Because of the huge swings caused by the scale of the pandemic - typically claims only vary by 20,000 or less from week to week, but since the start of the pandemic, swings of 50,000 or 100,000 per week have happened as often as not - and because the holiday season even in ordinary years plays havoc with seasonal adjustments, I have been posting the YoY% change in the numbers as well, since they will be much less affected by scale.

Here’s what that looks like:

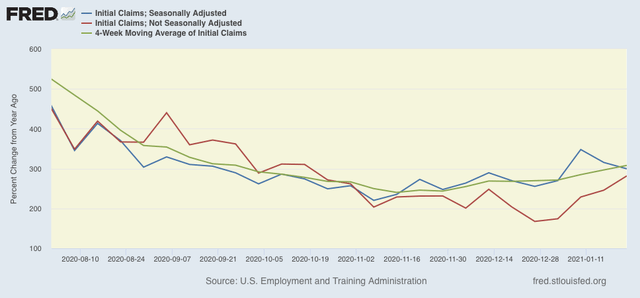
There is much less noise in the numbers, and while the change is more muted, the trend is now clearer. Both seasonally adjusted metrics are more than 300% higher YoY vs. 200-225% in November, while unadjusted claims are close to 300% vs. just over 200% higher YoY in early November.


The story remains different with continuing claims, which historically lag initial claims typically by a few weeks to several months. Seasonally adjusted continuing claims declined by 203,000 to 4,771,000, while the unadjusted number declined by 274,055 to 5,208,719, both yet another pandemic low:


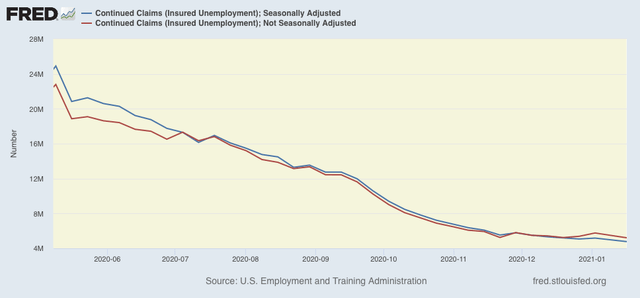
Because these lag initial claims, I have suspected that we would see an upward reversal, but obviously that hasn’t happened yet.

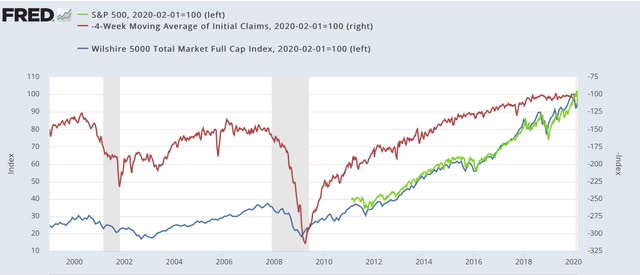
As I usually note, a reminder that both initial and continued claims remain at or above their worst levels from the Great Recession.

Finally, because for the past three weeks new claims have averaged about 40,000 higher than the comparable weeks in December, it appears more likely than not that we will see another slightly negative jobs report for January when it is reported next week.

Winter is going to give way to spring from south to north over the next 10 weeks, and already we have seen a much more coherent, comprehensive, and forceful approach to the pandemic from the new Biden Administration. For both of those reasons, I am expecting the trend in claims to peak and to reverse again by the beginning of April - hopefully for good.

Wednesday, January 27, 2021

The Quick and Dirty economic indicator forecast: another vote for “Here Comes the Sun”


 - by New Deal democrat

Still no important economic news yet this week, so let’s take a look at something I haven’t updated in awhile: the Quick and Dirty economic indicator of stock prices vs. new jobless claims.


Both metrics are short leading indicators, although historically stock prices have been more leading (3-9 months) than jobless claims (roughly 2-3 months). Both have the advantage of being updated daily or weekly, so we don’t have to wait a month for each update. If they are both going in the same direction (i.e., positive or negative) it’s a pretty good proxy for the overall direction of the economy in the months to come.

Here is the historical view of the actual readings of two stock market indexes - the Wilshire 5000 Total Market Index (blue) and the S&P 500 (green), plus the inverted reading of new jobless claims (red) for the past 20 years up until the pandemic hit:


Viewed this way, they aren’t too much help aside from noting that they appear to turn down in tandem prior to both of the past 2 recessions before the pandemic.

A better way to get information from them is to compare the YoY% changes, again with initial jobless claims inverted (because fewer is better):


They don’t always move in tandem, and usually - but by no means always! - stocks move first. This is because traders evaluate stocks based on anticipated *future* returns, whereas jobless claims react to present consumer demand situations.

In general, when both are better by less than 10% YoY, and decelerating sharply towards 0, the economy has a problem. When they are both negative, the economy is almost always about to enter a recession.

Here’s what the absolute index values look like for the past 12 months:


And here’s what the YoY% readings are:


After slowing during the summer and pausing in fall, stock prices have taken off again in the past few months. They have been consistently up over 10% YoY.

In other words, the Quick and Dirty economic indicator is not giving a recession signal, and is suggesting that with the end of winter (resumption of meaningful outdoor dining and other activities) and vaccine approvals and distribution, the economy is going to resume further growth in springtime.

One more reason why “Here Comes the Sun” is the theme song of 2021.

Monday, January 25, 2021

Coronavirus dashboard for January 25: a vaccination race against time vs. the new mutations


 - by New Deal democrat

All of the significant economic data is backloaded this week, onto Thursday and Friday. So don’t be surprised if I take a day off between now and then.

In the meantime, here is a Coronavirus update.

First things first: the most ominous thing I’ve read about the new coronavirus mutations comes from Dr. Eric Fiegl-Ding, who says, quite bluntly, “We need to switch to KN95, KF94, or European FFP2 masks ASAP. The new B117 COVID 19 is just too contagious. Cloth isn’t enough anymore folks.”

Everyone needs to take heed of that advice. There’s also evidence that the B117 variant infects people with much higher viral loads (I.e., copies of the virus at the outset), increasing the fatality rate significantly for older people. 

In the meantime, here is where we stand.

Total confirmed infections: 25,127,000 (I suspect the true number, including cases that were never tested, is closer to 33 million, or 1 in 10 Americans)
7 day average for last week: 170,032 (down from 249,168 peak on Jan 11)
Total deaths: 419,217
7 day average for last week: 3,088 (down from 3,355 peak on Jan 13)

Here are the 7 day averages for infections, hospitalizations, and deaths per capita graphically (note separate scales):


There really isn’t a meaningful lag between confirmed infections and hospitalizations, indicating people are waiting till they are quite sick before getting tested. Deaths still lag both infections and hospitalizations. Crossing my fingers that we have hit the winter peak for all three metrics already, but very worried about the B117 variant, since most experts think it will become the dominant strain in the US by March - and because it is so much more infections, that means yet another spike.

Now here is the vaccination data:

Total vaccinations: 20,537,900
7 day average for last week: 1,179,830 (new high)

Here is the average graphically, per capita:


The good news is that the rate of vaccination has continued to increase, and already surpasses Biden’s 1 million per day goal. But in order to get everyone vaccinated by the end of 2021, we need to see that rise to over 2 million per day. And in order to get older people vaccinated before the new mutations cause a big spike in deaths, we probably need to see that rise to over 3 million per day in the next 45 days.