Saturday, May 30, 2020
Weekly Indicators for May 24 - 28 at Seeking Alpha
- by New Deal democrat
My Weekly Indicators post is up at Seeking Alpha.
The news can be summed up in two words: “less awful.” With the exception of one employment measure, every other indicator has bounced off their recent lows, some very substantially. Meanwhile lower interest rates are setting the stage for growth after the pandemic effects ebb.
As usual, clicking over and reading helps reward me with a couple of pennies for my efforts.
Friday, May 29, 2020
April personal income and spending: considering the extreme circumstances, a good report
- by New Deal democrat
April personal income and spending, reported this morning, showed the impact of both the lockdowns and the stimulus that was passed by the Congress.
To cut to the chase, spending in real inflation-adjusted terms declined -13% (red), while real income rose 11%(blue):
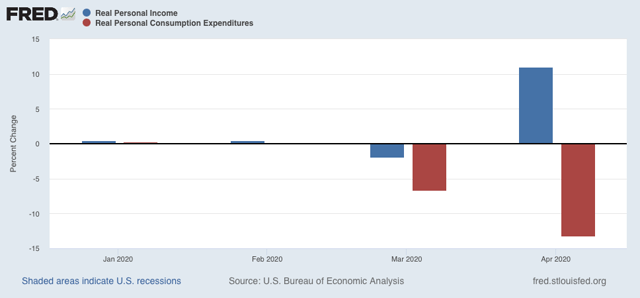
Unlike the recent jobs report, this is not a byproduct of the layoffs that were concentrated in the lower wage sector, which changed the composition of the labor force. Rather, this is an aggregate number, meaning that total income for everybody, adjusted for inflation, rose 11%
As a result of the combination, the personal savings rate rose by 20%:
As a result of the combination, the personal savings rate rose by 20%:
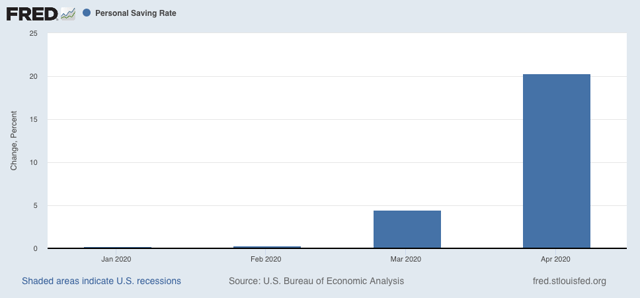
Depending on what happens with the intensity (or not) of “safer-at-home” orders in the future, and whether or not there is any further stimulus enacted by Congress (looking increasingly unlikely), this will either have to tide over the 20%+ of the labor force that has filed for unemployment in the last two months, or will serve as fuel for robust consumer spending once people feel it is safe to resume relatively normal activities.
Given the extreme circumstances, this was a good report.
Thursday, May 28, 2020
Lawrence Summers discovers bargaining power
- by New Deal democrat
Mainline macroeconomics pretends to be “value neutral,” by which practitioners mean that they assign no moral value to the supply or demand curves to the participants in the economy: they simply exist. The question of *why* participants in the economy have particular supply and demand curves is simply not even in the universe of parameters.
But in my experience “why” participants in an economy are willing to pay x amount for y good or service most often comes back to bargaining power. My ability to coerce if necessary a particular outcome comes down to the financial ability to walk away from the transaction. Or, as I have quoted a few times before, “Thems that has, git’s.”
Yesterday the following abstract of a new economic paper, “The Declining Worker Power Hypothersis,” from Lawrence Summers and Anna Stansbury came across the transom:
Rising profitability and market valuations of US businesses, sluggish wage growth and a declining labor share of income, and reduced unemployment and inflation, have defined the macroeconomic environment of the last generation. This paper offers a unified explanation for these phenomena based on reduced worker power. Using individual, industry, and state-level data, we demonstrate that measures of reduced worker power are associated with lower wage levels, higher profit shares, and reductions in measures of the NAIRU. We argue that the declining worker power hypothesis is more compelling as an explanation for observed changes than increases in firms’ market power, both because it can simultaneously explain a falling labor share and a reduced NAIRU, and because it is more directly supported by the data.Hoocoodanode?!?
Initial and continuing jobless claims: good “less worse” news
- by New Deal democrat
Weekly initial and continuing jobless claims give us the best snapshot of the continuing economic impacts of the coronavirus to the average worker.
Ten weeks in, there is some significant “less bad” news.
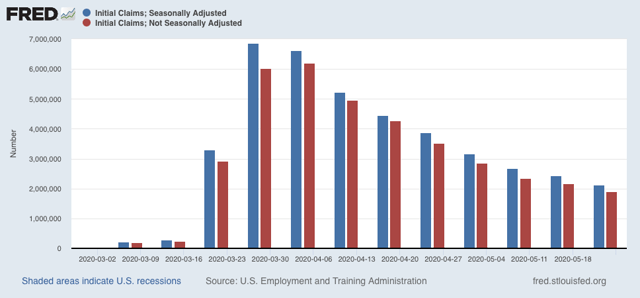
First, here are initial jobless claims both seasonally adjusted (blue) and non- seasonally adjusted (red). The non-seasonally adjusted number is of added importance since seasonal adjustments should not have more than a trivial effect on the huge real numbers:
There were 1.915 million new claims, which after the seasonal adjustment became 2.123 million. This is a -323,000 decline from last week’s number, and the lowest so far since the virus struck.
Since those laid off due to the initial lockdowns presumably have already applied for benefits, and we are three weeks after some States “reopened,” these new claims primarily represent the spreading second-order impacts of the coronavirus shutdowns.
The bad news is that new economic damage has continued to spread. The “good” news, as mentioned above, is that the spread - while huge - is diminishing.
The “less bad” trend also showed up in continuing claims, which lag one week behind. Both the non-seasonally adjusted number (red), and the less important seasonally adjusted number (blue) fell, by 3.6 million and 3.9 million respectively:
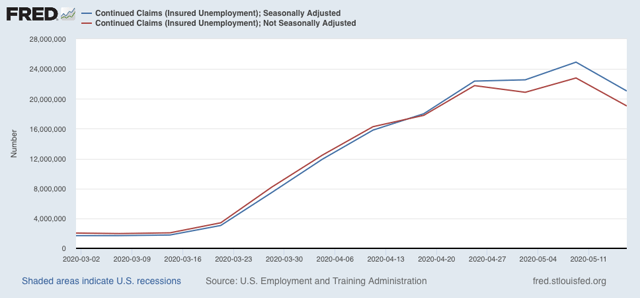
This tells us that, as of two weeks ago, there were enough callbacks to more than offset the new damage.
Climbing back from recession bottoms always has to start with “less awful” news, and this is what we got in this week’s jobless claims report. At the same time, as I wrote the other day, the jury is still very much out on whether new lockdowns or other restrictions will have to resume in States that declared a Virus Jubilee and recklessly reopened too soon.
Tuesday, May 26, 2020
Coronavirus, the economy, and the election: the jury is still out on all three
- by New Deal democrat
There is some housing data out today; I’ll probably have a post up about it tomorrow at Seeking Alpha, and I’ll link to it here.
Meanwhile, the jury is still out on the effects of the “reopening” of many States on coronavirus infections.
Here’s a graph of the 7 day average of tests, new infections, hospitalizations, and deaths, divided between the Boston, NYC, Philadelphia metro areas and Michigan on the one hand and everywhere else:
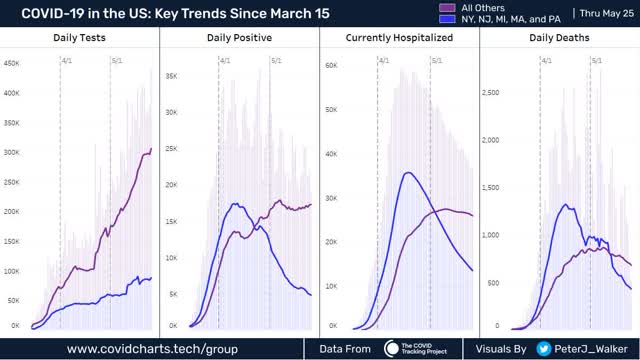
Testing has continued to increase dramatically, while cases “everywhere else” have plateaued or possibly begun to slightly rise again. This still shows hospitalizations and deaths declining.
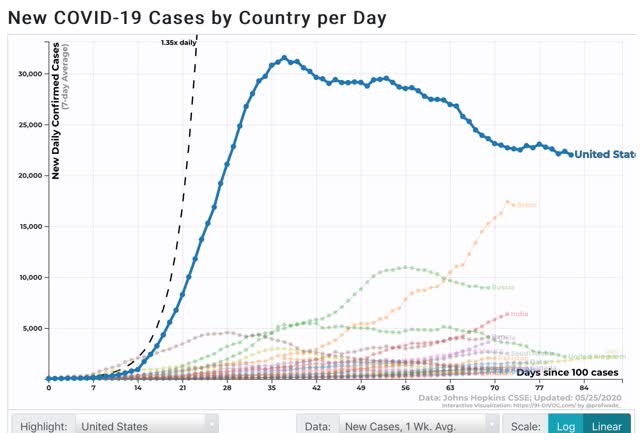
On a nationwide basis, new diagnoses have only declined by 3%, from 22,700 to 22,000, in the past eleven days, during which testing has roughly plateaued at the 350,000-400,000 level daily:
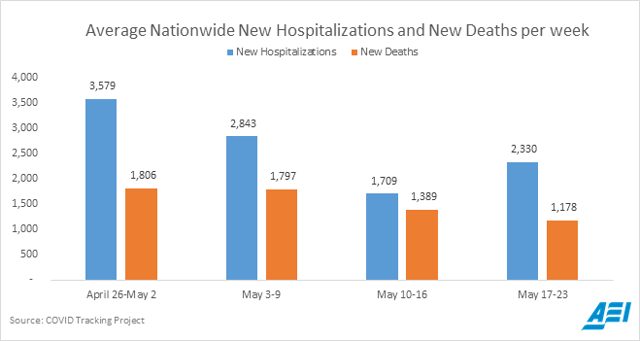
But Scott Gottlieb pointed to data yesterday showing that hospitalizations have begun to increase:
If tests continue in the recent range for two more days, that will give us a more “clean” period of 14 days over which to compare sequential 7 day averages. That would give us a better look at whether what is going on with diagnoses is an artifact of increased tests; or whether we are seeing an incipient “second wave” from overly-relaxed restrictions in many States.
On the bright side, Oregon looks like it has become the first moderate-sized State (its population is 4.2 million) to “crush the curve.” In the past seven days, it has averaged only 9 new diagnoses per day:
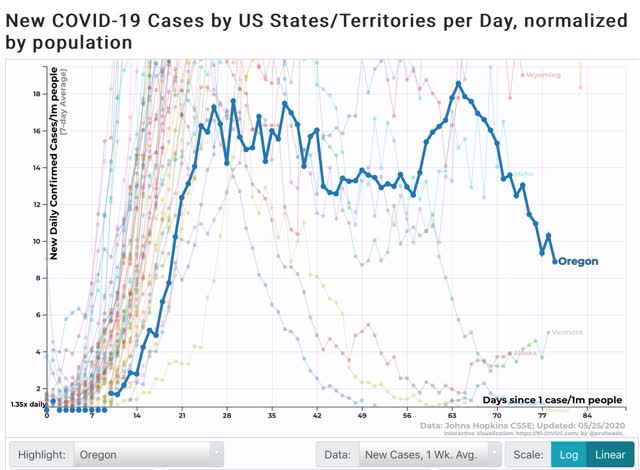
It’s probably still not quite big enough to get the national attention that would serve as an example for other States.
Meanwhile, Trump’s polling on the handling of the coronavirus continues to worsen:
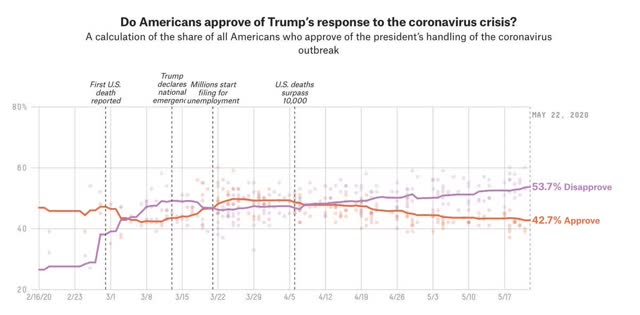
Note the brief “rally round the flag” increase in approval during the three week period that started when Trump said that the virus was a serious threat and ended when he reverted to wanting everything “opened up,” and the slow but steady erosion in approval since.
This correlates with the brief “rally round the flag” effect as to his overall approval:
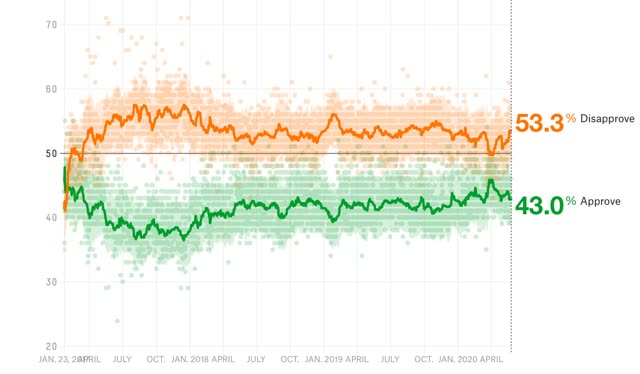
Trump’s approval has always been at its worst when he appears both cruel and incompetent simultaneously, and calling on people to get sick and die so that the economy can improve looks like just such an event.
Whether and to what extent infections increase is going to be driven by abatement in social distancing, mask-wearing, and exposure to confined indoor spaces with recirculated air. The economy is going to respond to how people respond to the continued threat of infections. Since Trump is incapable of changing who he is, what happens with infections and the economy is going to drive how much his vote in November deviates from 43%.
Sunday, May 24, 2020
Coronavirus dashboard: emphasis on testing
- by New Deal democrat
I want to focus this edition on testing issues.
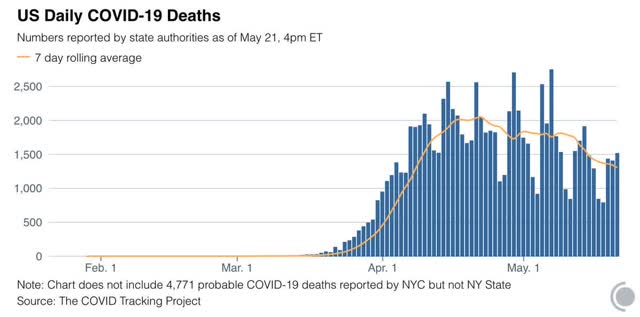
While the seven day average number of deaths continues to decline:
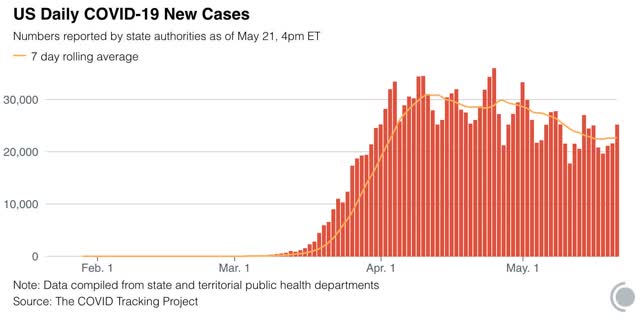
The seven day average number of new infections has leveled off:
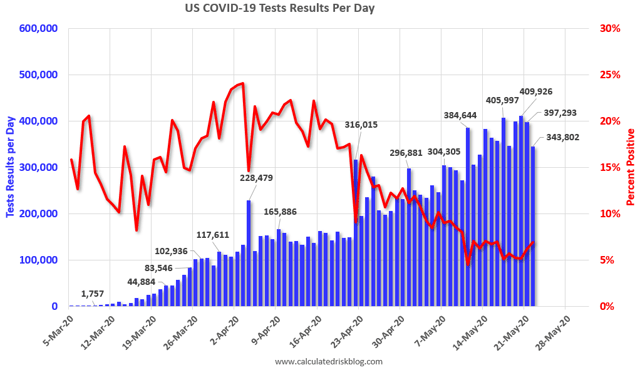
The average number of daily tests *may* also be leveling off again in the past few days:
What is worse is that the number of new cases in the US has only declined -22% from its peak in the last 45 days. Meanwhile, even hard hit countries in Europe like Spain have seen a -90% decline from peak in new cases over a similar timeframe:
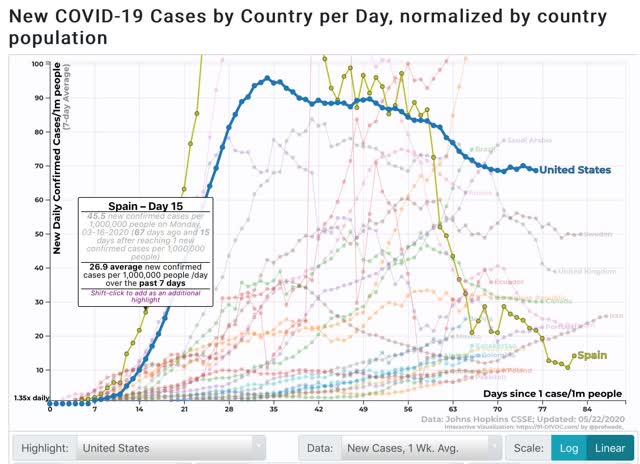
Even hardest-hit Belgium has had a -80% decline from peak (not shown).
The pessimistic explanation for this is that the US’s response, on the whole, has always been half-hearted at best. That may be the case, and at very least it is part of the explanation.
The more optimistic explanation - and I think this is the main part of the answer - comes back to a poor level of testing.
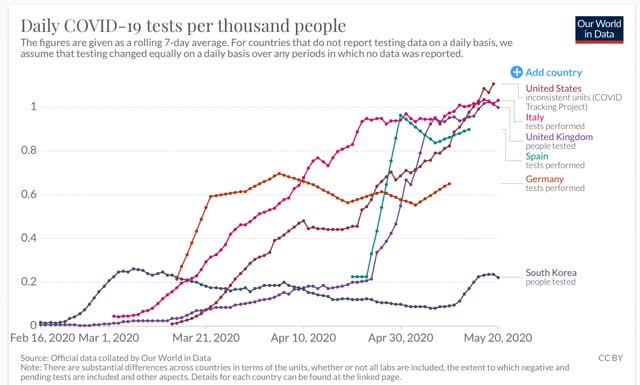
As I pointed out yesterday, in the matter of testing the US started late, with an abominably low number of tests in March and early April, and only in the past week to 10 days equaled and finally slightly surpassed the level of testing per capita in comparable countries in Western Europe:
On a cumulative basis, the US come in dead last for per capita number of tests administered (We’re number 178!!!)(column at far right):
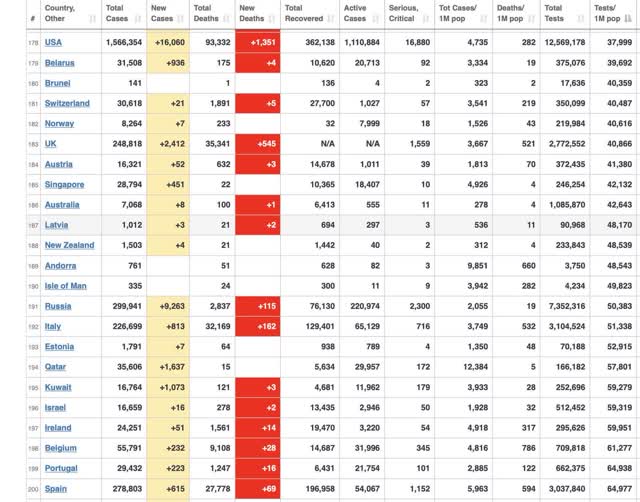
Altogether the US had administered 38,000 tests per million people, while Italy has tested 51,000, Belgium 61,000, and Spain 65,000.
A study of 366 US counties just published by the Surgo Foundation indicates that the US has probably missed 40,000 deaths or more, especially in rural counties, by its failure to diagnose infections:
Here’s a graph from the study showing the trend:
Our data suggest that we may be especially undercounting COVID-19 deaths in Southern parts of the US. In more than 200 of the counties we examined, excess death rates were between two times to 30 times higher than reported COVID-19 death rates.
On average, excess death rates are 30% higher than reported COVID-19 death rates.
Here’s a graph from the study showing the trend:
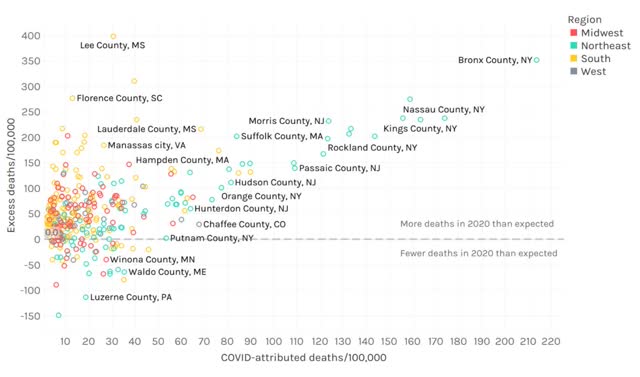
In general, the higher the rate of coronavirus infection, the higher percentage of deaths that have been missed. Further, note the above is deaths only, not even total diagnoses. Probably the number of diagnoses missed has been about 5x or more the number of deaths missed.
In short, in March and April the US was missing a huge share of coronavirus infections, that have been increasingly picked up since testing increased beginning in late April.
If you go back and take a look at the fourth graph in this post above (comparing US cases per capita with Spain), you can see that there was a similar leveling off in the number of new cases during the middle portion of April just after a big increase in testing. I suspect that the current leveling off in new cases primarily reflects that the US as a whole finally ramped up testing enough to catch these cases.
The silver lining is that about half of the US is probably near, if not at, the point where it is performing enough tests to begin transitioning to a “test, trace, and isolate” regimen. Here’s a graph from The Johns Hopkins University’s Coronavirus Resource Center, making use of the WHO‘s recommended positivity rate of 5% or below for 14 days before implementing a “test, trace, and isolation” regimen, indicating that 26 US States and territories have reached that point in testing. The other 26 have not:
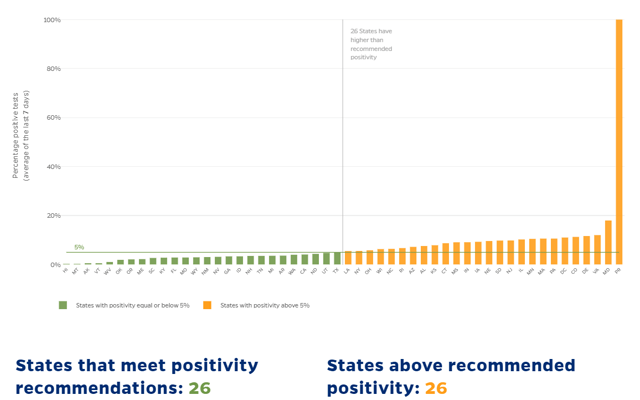
The huge spike at the right end of the graph is Puerto Rico, which is an order of magnitude off the number of tests that need to be performed, followed by Maryland.
It will probably take about another week to see if the trend in new cases starts to decrease again, or whether the reckless “reopening” of many States begins to show up in a second wave of new infections.
Subscribe to:
Posts (Atom)