Saturday, June 17, 2023

Weekly Indicators for June 12 - 16 at Seeking Alpha


 - by New Deal democrat


My Weekly Indicators post is up at Seeking Alpha.


Stocks are really buying the “soft landing” scenario, rising to repeated 12 month+ highs, apparently aniticipating that corporate profits will be off to the races again.


Meanwhile, when we look at consumer spending, which is 70% of the economy, restaurant reservations, which are one of the easiest things for consumers to cut back on, continue to slowly fade downward, while retail spending as measured by Redbook also continues to inch towards turning negative as well.


As usual, clicking over and reading will bring you up to the virtual moment about the economy, and reward me a little bit for my efforts.

Friday, June 16, 2023

Real total business sales estimated unchanged for both April and May, 1% below January peak


 - by New Deal democrat


A recession is a sustained and significant downturn in production, sales, income, and employment. Here’s what the monthly indicators of those look like, normed to 100 either as of January, or in two cases to their 2022 peaks:


Notice that sales (gold) are reported with a 2 month lag. We won’t know real manufacturing and trade sales for April until 2 weeks from now. 

So I’ve developed several methods for making early estimates. Based on those, we can make a good final estimate for April now, and a preliminary back of the envelope one for May as well.

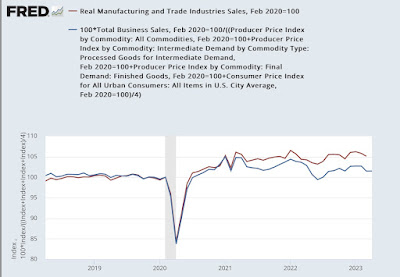
Yesterday the last component of nominal sales, for the manufacturing component, were reported. As a result, nominal total business sales increased 0.1% in April. I use an unweighted average of CPI and commodity, intermediate, and final goods from the PPI as a deflator. This gives us a very good estimate of real manufacturing and trade sales:


Since the average of the 4 inflation measures was +0.1% as well, this means that the final estimate for real manufacturing and trade sales for April is unchanged.

Turning to May, we do have real retail sales, which are about 1/3rd of the total measure, as well as industrial production, a proxy for real manufacturing sales. We don’t have inventories or wholesale sales, so this method is much less reliable, but it does capture the trend over time:


This method gives us a preliminary, back of the envelope estimate of 0.0%, or unchanged, for May as well.

This leaves both April and May 1.0% below the January peak for real sales.

The economy continues to be held up by real spending on services, and the ensuing growth in payrolls.

Thursday, June 15, 2023

Industrial production continues to falter in May


 - by New Deal democrat


My final update this morning is for industrial production, the King of Coincident Indicators, which has most frequently corresponded with peaks and troughs in economic activity as determined by the NBER.


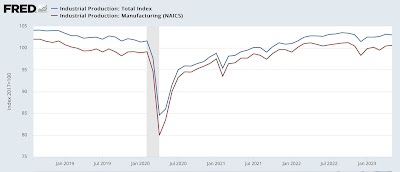
The news for total production was not good, as it declined -0.2% in May, and March and April were revised -0.2% lower each. It remains -0.5% below its recent peak last September. Manufacturing production did increase 0.1%, and March and April were revised higher, but it also remains -0.6% below its recent peak last October:


YoY production is up 0.2%, and manufacturing production is down -0.3%. In the 80 last years of the 20th century, total production had only been this low YoY several times in the 1950s and also in 1984 without there being a recession. Manufacturing production had a similar record once it was separately recorded in 1964. But since the “China shock“ that started at the turn of the Millennium, however, there have been 3 separate downturns that were as bad or worse, without there being a recession:


To sum up the three data series I have reported on this morning, *all three* are at or close to levels which for most of their past history have been consistent with recessions. As I’ve noted several times recently, the economy is being buoyed by real personal spending or services, and by job growth that is still trying to catch up with that increased spending ignited originally by the pandemic stimulus.

Later this morning total business sales for April will be reported. I’ll take a look at those, and estimate what they mean for another important coincident indicator, tomorrow. 

Real retail sales continue to suggest recession, decelerating employment gains


 - by New Deal democrat


The second of the three important datapoints this morning was retail sales for May. This is one of my favorite indicators, because it has several leading relationships, and is also an important component of one of the main data series that the NBER looks at in dating recessions.


Nominally retail sales for May increased 0.4%. After adjusting for inflation, the increase rounds to 0.2% (blue in the graph below). This remains close to the lowest absolute levels of retail sales in the past 2 years. Because real retail sales correspond closely to real personal consumption expenditures for goods (red), I include that as well:


YoY real retail sales are down -2.4%. In the past 75 years, this has almost always been recessionary. Since it is also a short leading indicator for payroll employment (gold), it implies continuing gradual deceleration in the growth of monthly jobs as well:


Note that I have discounted the big YoY declines last spring, which were in comparison to the 2021 spring stimulus spending spree. The effects of that engorgement are waning.

I suspect that personal consumption expenditures will resolve in the direction of real retail sales, but we won’t know that for 2 more weeks at least.

Initial and continuing claims edge closer to signaling recession


 - by New Deal democrat


There’s a blizzard of data this morning. I’ll report on retail sales and Industrial production later.

But let’s start with initial jobless claims, which were unchanged this week at 262,000, the highest level in over 18 months. The 4 week average increased 9,250 to 246,750. Continuing claims, with a one week lag, increased 20,000 to 1.775 million:


Recently a similar spike over 260,000 was revised away due to a State’s reporting issue. So far it has not happened this time.

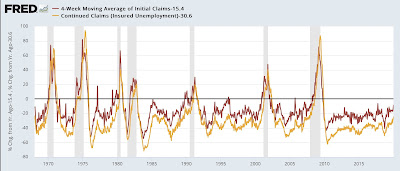
YoY initial claims are up 20.7%. The more important 4 week average is up 15.4%, the first time it has been over 12.5% since immediately after the pandemic. Continuing claims are up 30.6%:


Here is 50 year+ look at the Yoy% change in the 4 week average and continuing claims, both normed to 0 as of this week’s reading:


Except for brief spikes of only a few weeks, only once in the past 50+ years (specifically, 1989) has the 4 week average of initial claims been this higher YoY without there being an imminent recession. Continuing claims this much higher YoY has *always* signaled a recession, with no false positives or negatives.

Finally, since initial claims lead the unemployment rate, here is what the latest data implies for the YoY change in the unemployment rate in the next several months:


The unemployment rate could climb another 0.2% or 0.3% in the next few months. This would still not trigger the Sahm rule, which retrospectively reliably tells us we are in a recession after it starts.

Wednesday, June 14, 2023

Producer prices continue sharp deceleration; real average and aggregate nonsupervisory pay continues to increase


 - by New Deal democrat


Historically producer prices were more upstream of consumer prices, but since the 1990s and the employment of “just-in-time” inventories, that has been less the case. So I normally don’t pay too much attention to the monthly PPI.


But for the record, PPI continues to confirm, and amplify, what we’ve seen in CPI. That is, a steep decline in monthly readings compared with a year ago, causing the YoY comparisons to decline sharply as well.

Headline PPI is now only up 1.2% YoY, while commmodity prices are down -7.1%:


Here’s how headline PPI compares with headline CPI YoY:


And here’s how core PPI (up 5.0% YoY) compares with core CPI (up 5.3%YoY):


Since last June’s inflection point, final demand PPI is down -3.6% and commodities are down -9.4%:


In short, deceleration and even outright decline all around. Keep in mind that one big difference is that unlike CPI, PPI does not have a significant “shelter” component.

Meanwhile, yesterday’s CPI report also allows us to update several important income metrics for the American working and middle class.

Real average hourly earnings in May increased 0.3%, continuing their rise since last June’s inflection point at peak gas prices:


And aggregate payrolls for nonsupervisory workers also increased YoY:


This latter metric is an excellent “fundamentals-based” marker for recessions, which almost always occur when it goes negative. This improvement is the best argument against there being any imminent recession - in the aggregate, in real terms, average American households are bringing home more income.

Tuesday, June 13, 2023

CPI less shelter up only 0.7% in last 11 months (0.8% annualized rate)


 - by New Deal democrat


Let me cut to the chase right from the outset: except for the very lagging measures of shelter; motor vehicle parts, repairs and insurance; and to a lesser and waning extent, food; consumer inflation is now well-contained and close to the Fed’s target rate.

First, let’s look at the headlines, with the monthly and YoY rates of change:

Total CPI up 0.1% m/m and 4.0% YoY (lowest since April 2021)
Core CPI up 0.4% m/m and 5.3% YoY (lowest since November 2021)
CPI less shelter up +0.1% and 2.2% YoY (lowest since February 2021)
Core CPI less shelter up +0.3% and 3.4% YoY
Energy down -1.2% m/m and down -11.7% YoY
Food up +0.2% m/m and up 6.7% YoY (lowest since December 2021)
New cars up +0.2% m/m and 4.7% YoY (lowest since May 2021)
Transportation services (parts, insurance, repairs): up +0.8%  and up +10.3% YoY (vs. October 2022 peak of 15.3%)
Owners Equivalent Rent up 0.6% m/m and 8.0% YoY (down -0.1% from all time YoY high)

This is the same pattern as we saw last month ago, just even more amplified: “Lowest since…” for almost everything *except* shelter, which is close to its all-time YoY high set one month ago.

And let me further headline that fact right here: CPI less shelter since last June is only up 0.7%:


That’s an annualized rate of 0.8%.

Keep in mind that shelter component of official inflation, which is 1/3rd of the total, and 40% of the “core” measure, badly lags the real data - as in, by a year or more.

Next, here is the YoY% change in headline inflation (blue), core inflation (red), and inflation ex-shelter (gold)


Both have been in decelerating trends since last June (headline and ex-shelter) or last September (core).

Here are the other big drivers of inflation for the past several years outside of shelter: food (blue), new vehicles (gold), used vehicles (gray), and transportation services (red, /4 for scale!):


All of these are well off their highs, and used vehicles have been negative YoY for a number of months. Aside from food, which is weighted at 13.4% of the total, transportation services are only 5.9%, and new and used vehicles combined only 7.0%.

Next, because of the importance of shelter to my analysis, here is an updated long term YoY graph of the big culprit, Owner’s Equivalent Rent (blue), which increased another 0.5% in April, with the FHFA house price index (red, /2.5 for scale), which has been declining since last June and was up 4.0% as of its last reading for February:


Exactly as I have been saying for the past 18 months, house prices dragged OER higher and with it the CPI indexes, with about a 12 month delay. House prices on a YoY basis plateaued for a year between late spring 2021 and mid year 2022, and now OER has finally plateaued as well. The only remaining issue is how long it will remain at that plateau before it follows house prices back down.

Finally, here is “sticky” core inflation ex-shelter:


Even this measure is declining, although less than a “non-sticky” index would be.

As noted above, the FHFA index is only up 3.6% YoY as of March. If it has continued to decline in the 2 months since then at the same rate, it is only up about 2.0% YoY currently, vs. 8.0% for OER. If the FHFA index were substituted for OER, then total YoY CPI for May would only be 2.7%. Core inflation would only be up 2.9% [Note: I originally miscalculated this as 3.5%]. Neither of these warrants continued restrictive interest rate policy.

In summary, properly measured inflation is no longer a significant issue. Even if OER is a valid way to measure housing inflation, because of the serious lag the Fed should be relying on house prices, and at very least pause.

Monday, June 12, 2023

Are personal consumption expenditures a helpful forecasting (or even nowcasting) metric? An overview


 - by New Deal democrat


As I’ve noted a number of times recently, in addition to payrolls the other positive datapoint keeping the economy growing is real personal spending. Here is what it looks like in total, plus broken down by goods and services for the past several years:


The trend in both, at least since last June, is definitely higher. On the other hand, real spending on goods has not made a new high since January.

In this post I take a deeper dive into the history of this important indicator, and where it might be headed from here.

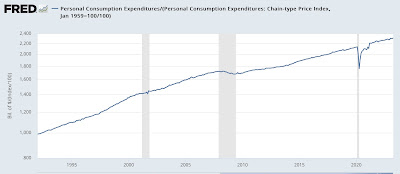
Personal income and spending have been reported since 1959. There is a deflator for the total series, and separate deflators for goods and services as well. The NBER lists the total series as a coincident indicator they consider in determining if the economy is in expansion or recession. Here is what that looks like since the inception of the series (all graphs below in log scale):


If it isn’t clear from the graphs themselves, in 3 of the 9 recessions since 1959, real spending has peaked the exact month of the onset of the recession; 1 time it peaked 2 months before, 1 time one month later, 1 time 5 months later; and 3 times (1970, 1981-2, 2001) it did not go down significantly at all during the recession. So we have an indicator that more often that not turns down after the recession started or not at all.

The situation is even less helpful when we look at real spending on services:


Not only did services spending not go down at all in 3 of the 9 recessions (1960, 1970, 2001), but in 2 others (1974, 1981) it went down no more than -0.7% over a 3 month period during the recession, and ended the recession at a higher level than when the recession started. In 3 of the remaining recessions it turned within one month of the onset of the recession, and in the remaining 1 (1974) it did not turn down until 10 months later! In other words, although its growth does decelerate, for all intents and purposes real spending on services does not signal a recession at all. 

But real spending on goods gives us a better signal:


On only 1 occasion (2001)  did real spending on goods not turn down during a recession. On 3 occasions it turned down the month of or one month after the recession started, and 1 (1970) time it did not turn down until 9 months later. But on 5 of the 9 times, it turned down between 2 and 9 months before the recession got started.

This makes real spending on goods a legitimate, if weak, short leading indicator.

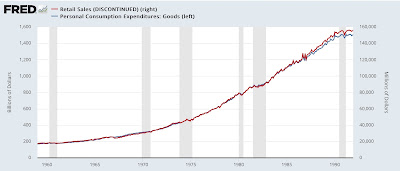
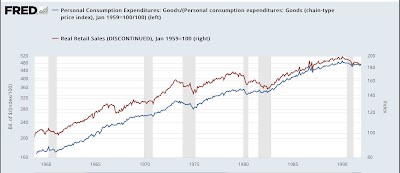
Further, as it turns out, nominal spending on goods tracks very similarly to nominal retail sales for the entire last 60 years:


What is different between the “real” measures of each is that the deflator for real personal spending on goods tends to show less inflation than the CPI as applied to retail sales:


Put another way, real retail sales tends to turn down either contemporaneously with, or a little before, real personal spending on goods.

With that in mind, here is what real retail sales and real personal spending on goods look like for the last 24+ months:


Real retail sales has definitively turned down, while as mentioned above, real personal spending on goods is less than -0.1% below its January high as of April. Past history suggests that this divergence is going to resolve in the next few months; and the likelihood is, it will resolve in favor of the current trend in real retail sales I.e., lower.

We’ll see in a couple of weeks.

P.S. I expect to have more to say, particularly as to how spending tracks with income, saving, and aggregate payrolls, later this week or next week.

Sunday, June 11, 2023

Weekly Indicators for June 5 - 9 at Seeking Alpha


 - by New Deal democrat


Forgot to do this yesterday, so let’s take care of that now …


My Weekly Indicators post is up at Seeking Alpha.


As has so often been the case recently, several of the coincident indicators got ever so slightly weaker, while several of the leading indicators have improved.


As usual, clicking over and reading will be educational for you, and just a tiny bit remunerative to me.