Saturday, August 29, 2020
Weekly indicators for August 24 - 28 at Seeking Alpha
- by New Deal democrat
My Weekly Indicators post is up at Seeking Alpha.
The economy as a whole is being driven by lower interest rates, unprecedented Fed supply of new money, stock market gains, and - through July - the Congressional emergency stimulus and unemployment benefits. This is still showing up in all indicator timeframes.
It took a few weeks for the effects of the pandemic lockdowns to show up in late March and April. I am still looking for effects of the end of the Congressional emergency assistance.
As usual, clicking over and reading should be educational for you, and rewards me with a couple of pennies for the efforts I put in.
Friday, August 28, 2020
Real personal income, spending, and consumer sentiment for July
- by New Deal democrat
July personal income and spending were reported this morning. Since real personal income drives one important election model, I have been waiting to see if July would reflect the end of the emergency Congressional assistance. It didn’t.
Real personal income rose less than 0.1% in July. While it is down by -6% from April, it is up a huge 7.1% from July 2019. Real disposable and Per Capita income show similar trajectories:
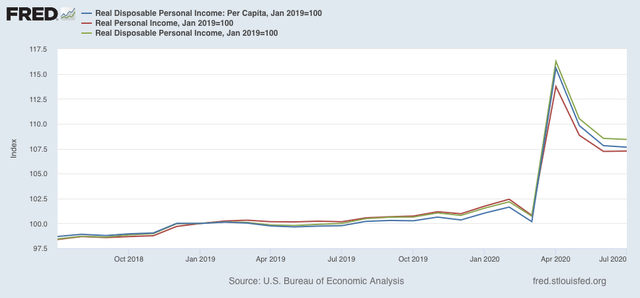
April represented the $1200 stimulus checks as well as the Congressional emergency assistance. The former was one time only; the latter ended at the end of July.
While I expect a substantial decline based on the end of the emergency unemployment assistance, since the election model based on the YoY change in real disposable personal income runs through the end of the 2nd Quarter, its result is baked in the cake.
As you can see from the below graph of the last 60 years, this year’s result is almost literally “off the chart”:
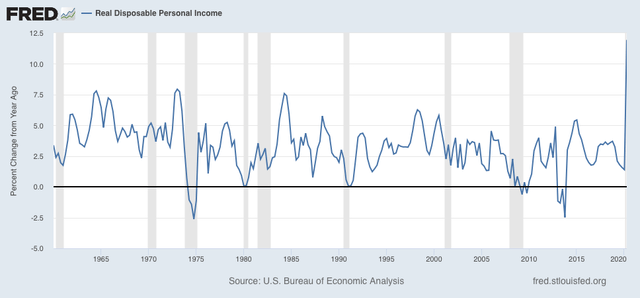
If the increase in real income were a natural outgrowth of the economy, the model would forecast a Trump landslide. So I am reporting it that way.
When we look at real personal spending, it’s a different story, as spending remains depressed at a level last seen before the pandemic in late 2017:
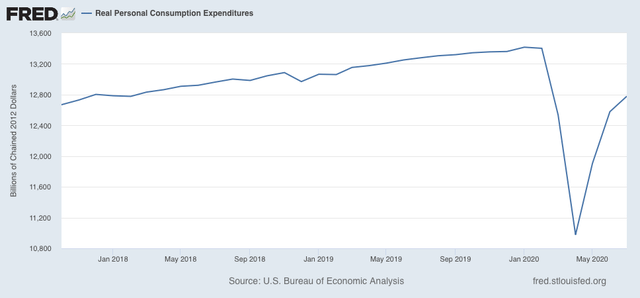
Increased saving and decreased spending is a very typical recession dynamic, as consumers are very cautious.
An important reason to discount the personal income-based election model this year is what we see in consumer sentiment as measured by the University of Michigan:
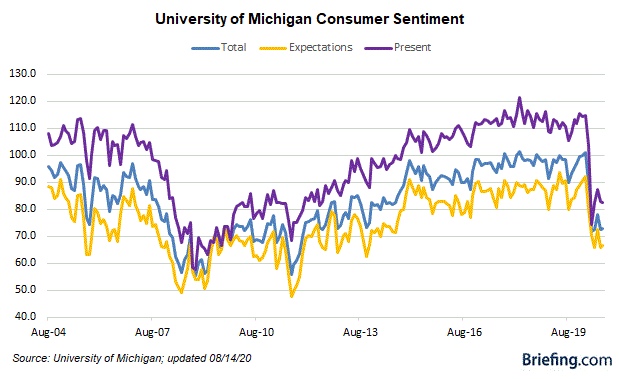
While sentiment about the present has rebounded somewhat from April, but is still depressed, sentiment about the near future has not improved at all, and is at levels last seen 7 years ago.
Short version: consumers were still getting increased cash as of July, but were spending less, and were very concerned about the future. This leads me to discount the election forecast, but may explain why Trump continues to get decent marks in polls for his handling of the economy even now.
Thursday, August 27, 2020
Jobless claims slowly continue to get “less worse,” while longer term deadweight loss builds
- by New Deal democrat
The good news in this morning’s jobless claims report is that the trend of “less worse” news continues. The bad news is that the improvement has slowed to a snail’s pace, at levels worse than the worst levels of the Great Recession.
On a non-seasonally adjusted basis, new jobless claims declined by 68,038 to 889,549, a new pandemic low. After seasonal adjustment (which is far less important than usual at this time), claims declined by 98,000 to 1,006,000, the second-“best” level of the pandemic after 2 weeks ago. The 4 week moving average also declined to a new pandemic low of 1,068,000.:
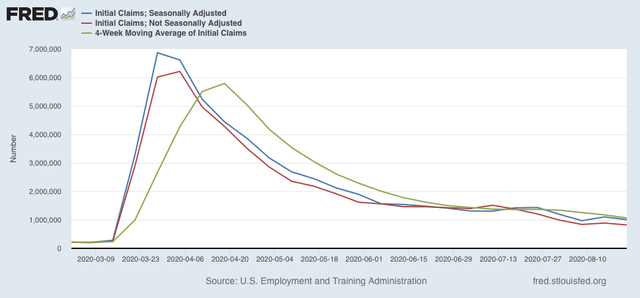
Continuing claims, on both an un-adjusted and seasonally adjusted basis also continued to decline to new pandemic lows, by 272,941 to 13,909,872, and by 223,000 to 14,535,000 respectively:
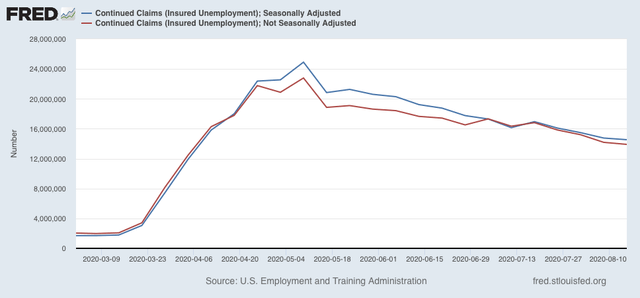
Continuing claims have fallen by roughly 40% from their peaks in early May.
Within the context of the pandemic recession, this counts as “good” (or continuing “less awful”) news. Nevertheless, both initial and continuing claims remain at far worse levels than even at their worst during the Great Recession.
The bigger picture is that we are almost 6 months into pandemic losses, and it is nearly certain that some temporary job and business losses have transitioned to permanent ones. In other words, even if the pandemic were to magically end tomorrow, there is a large amount of deadweight loss that is now in the system.
On a non-seasonally adjusted basis, new jobless claims declined by 68,038 to 889,549, a new pandemic low. After seasonal adjustment (which is far less important than usual at this time), claims declined by 98,000 to 1,006,000, the second-“best” level of the pandemic after 2 weeks ago. The 4 week moving average also declined to a new pandemic low of 1,068,000.:
Continuing claims, on both an un-adjusted and seasonally adjusted basis also continued to decline to new pandemic lows, by 272,941 to 13,909,872, and by 223,000 to 14,535,000 respectively:
Continuing claims have fallen by roughly 40% from their peaks in early May.
Within the context of the pandemic recession, this counts as “good” (or continuing “less awful”) news. Nevertheless, both initial and continuing claims remain at far worse levels than even at their worst during the Great Recession.
The bigger picture is that we are almost 6 months into pandemic losses, and it is nearly certain that some temporary job and business losses have transitioned to permanent ones. In other words, even if the pandemic were to magically end tomorrow, there is a large amount of deadweight loss that is now in the system.
Wednesday, August 26, 2020
Coronavirus dashboard for August 26: detailed State breakdowns
- by New Deal democrat
Total US infections: 5,777,710
Average last 7 days: 41,185/day
Total US deaths: 178,488
Average last 7 days: 952/day
Source: COVID Tracking Project
Today let’s look at both death infections and deaths. I’ve started to rate each State according to a system, so we’ll look at that after the overall picture.
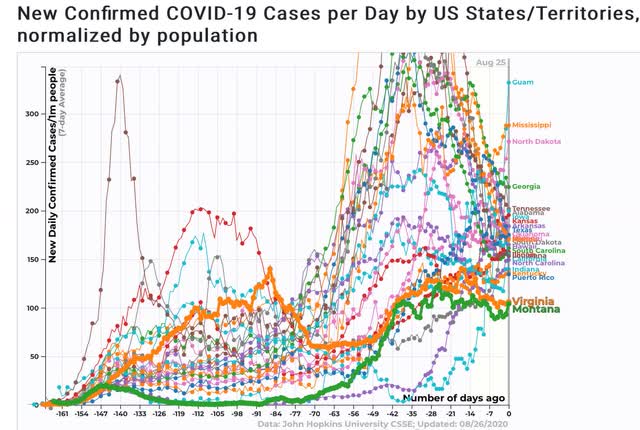
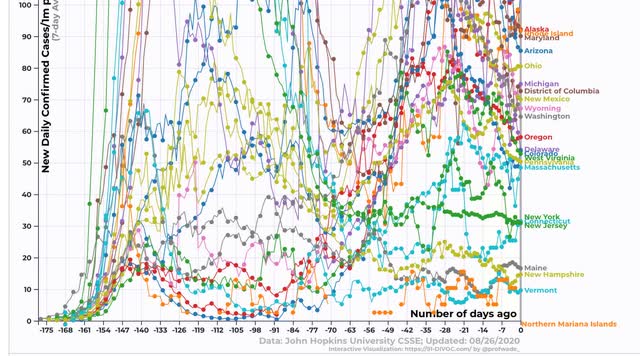
When it comes to new infections, only the Northeast is doing well. The best that can be said for the other regions is that the rate of new infections, while awful, has at least come down in the South and West in the past several weeks:

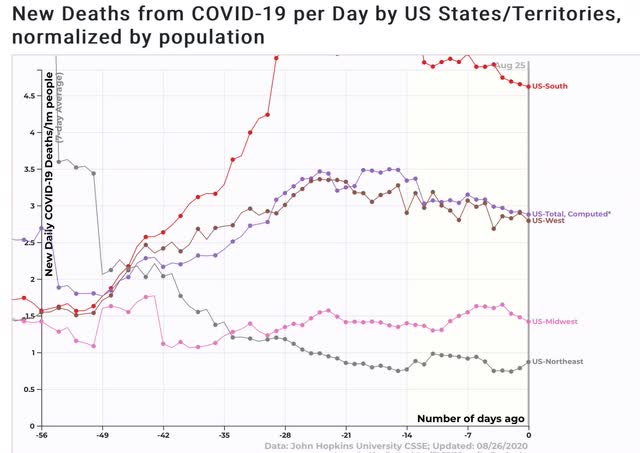
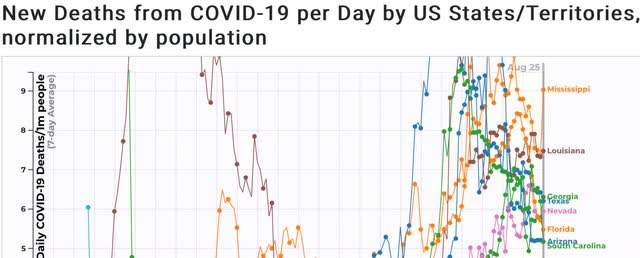
A similar pattern is the case as to deaths. In the Midwest, the pace of deaths has not increased nearly so much as infections:
Here is my own internal rating system as to how each State is doing:
Deep Red (general alarm out-of-control fire): 200+ infections per million, 5+ deaths per million.
Red (3 alarm fire): 100-200 infections, 2-5 deaths
Orange (2 alarm fire): 60-100 infections, 1-2 deaths
Yellow (1 alarm fire):40-60 infections, 0.5-1 deaths
Blue (smoldering/1 alarm fire): 20-40 infections, 0.2-0.5 deaths
Green (embers): 0-20 infections, 0-0.2 deaths
Applying this first to new infections, first, here are all States with 100 or more infections per million:
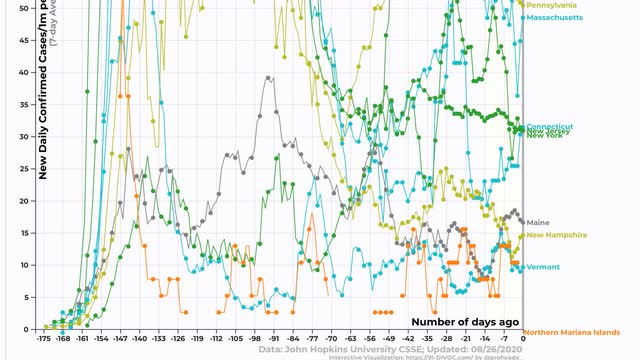
Next, those with less than 100 infections:
Finally, those with less than 50 infections:
Applying my rubric, here is the breakdown:
Deep red/general alarm fire:
MS
ND
GA
TN
AL
Red/3 alarm fire:
IA
KS
AR
TX
OK
NV
FL
SD
HI
SC
IL
LA
CA
NC
IN
KY
PR
VA
MT
Orange/2 alarm fire
AK
RI
MD
AZ
OH
MI
DC
NM
WY
WA
Yellow/1 alarm fire
OR
DE
CO
WV
PA
MA
Blue/smoldering
CT
NJ
NY
Green/embers
ME
NH
VT
Now let’s turn to deaths per million. First, here are all States with deaths of 5 or higher per million:
Next, States with 2 - 5 deaths per million:
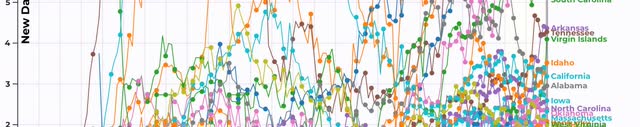
Next, States with 1-2 deaths per million:
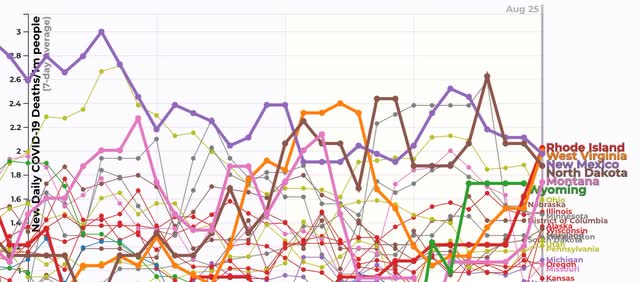
Finally, States with less than 1 death per million:
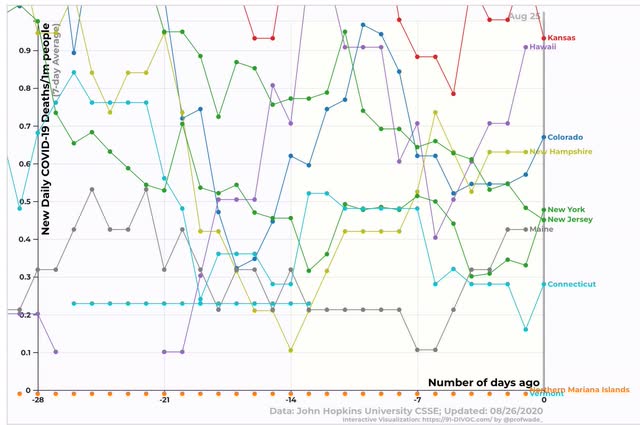
Applying my rubric, here is the breakdown as to deaths:
Deep red/general alarm fire:
MS
LA
GA
TX
NV
FL
AZ
SC
Red/3 alarm fire:
AR
TN
ID
CA
AL
IA
NC
OK
MA
KY
RI
Orange/2 alarm fire:
WV
NM
ND
MT
WY
OH
NE
IL
MN
DC
AK
WI
MD
WA
SD
UT
PA
MI
OR
MO
Yellow/1 alarm fire
KS
HI
CO
NH
Blue/smoldering
NY
NJ
ME
CT
Green/embers
VT
The only State that is in the clear (green) on both metrics is Vt. In contrast, most of the Deep South remains out of control. Most of the Northeast outside from MA and PA is doing quite well. A lot of the Midwest and Mountain West, which had been doing well several months ago, are in very poor shape, although not completely out of control.
I expect the situation to remain similar, with States waxing and waning between relative control and new exponential growth as people range between complacency and panic. This is only going to change with new national leadership and/or a vaccine.
Subscribe to:
Posts (Atom)