Saturday, July 7, 2007
QQQQ Break-Out?
The QQQQs have been in a slightly upward trending channel for the last three years. Are we going to see this break-out continue? Will we see a shift from a basic materials driven market to a technology driven market?
More On Consumer Spending
This is a chart from Martin Capital. Notice the following.
1.) The YOY change in retail sales has dropped since the beginning of 2006. However, it has picked-up since the beginning of 2007, possibly representing a reversal of the downward trend.
2.) New and existing home sales have been dropping since mid-2005.
3.) Car sales have consistently fluctuated between roughly 16 million/year and 17.75 million a year since 2001. However, the annual sales pace has consistently declined since the beginning of the year.
Friday, July 6, 2007

How Confident Are Consumers?
From CBS Marketwatch:
Over the last few years, I've written a fair amount about the heavy indebtedness of the US consumer. The short version is household debt has increased from a little over 70% of total US GDP in 2001 to over 90% in the fourth quarter of 2007. In addition, over the same period of time household debt has increased from over 90% of disposable income to over 130%. Mortgage debt is the primary reason for this increase, as households went on a huge home buying and mortgage equity withdrawal binge over the last few years.
However, I also predicted that the high debt load would lead to a recession or economic slowdown. While the economy did slow in the first quarter of 2007, predictions are for an increase in the second quarter. In other words, my analysis was right by my conclusion was wrong. At least it was wrong.
Is something different now? Has consumer spending reached a point where it will no longer increase, driving economic growth? I don't have an answer for that. However, the initial signs are the consumer is slowing his purchases -- at least for now.
However, history has demonstrated the US consumer loves to shop, and will do almost anything to continue shopping. The US economy has had more than ten straight years of quarterly increases in consumer spending.
For now, I will punt this question but will be thinking about it for quite some time.
Consider this news from Tuesday:
* Sales at retail chain stores continued to weaken in the last week of June. The International Council of Shopping Centers index barely grew week-over-week, while the Redbook index fell to a cyclical low, with same-store sales up just 1.2% compared with a year earlier.
* Vehicle sales declined for the sixth straight month in June. In the past six years, sales have been weaker on only two occasions. At the same time, the automakers have stepped up their production, setting up the industry for another round of layoffs and production cutbacks.
* Home sales fell again in May. The National Association of Realtors said the number of contracts signed on previously owned homes fell 3.5% to the lowest level since the recession.
* More consumers fell behind on their debt payments in the first quarter. The percentage of loans that were 30-days past due rose to the highest level since the recession of 2001.
The news in prior weeks hadn't been much better:
* Home prices fell 2.7% in the past year, the biggest decline in 16 years. A 2.7% drop may not seem like much, but considering how hard it is to get homeowners to accept less than they paid for their house, it's startling.
* Homebuilders got even more depressed about their industry. The housing market index fell to a 16-year low.
* Delinquencies on home mortgages are rising, especially for subprime loans. Unfortunately, delinquencies and foreclosures are also rising for borrowers with good credit who took out adjustable-rate loans. That's unheard of when the unemployment rate is under 5%.
* The stock market, after a nice run up from March to May, has been flat over the past seven weeks.
* Consumer prices rose 0.5% in May, the fastest monthly increase in 17 months.
* Real take-home income (that is, adjusted for inflation) has fallen two months in a row, after a big boost in the first quarter that mostly went to the ultra-rich who received mammoth bonuses and stock options. For the rest of us, the picture is a well-known story around kitchen tables: The median hourly wage, adjusted for inflation, has fallen four months in a row through May and was up just 1.1% in the past year.
* The personal savings rate was negative for the 26th consecutive month in May.
Over the last few years, I've written a fair amount about the heavy indebtedness of the US consumer. The short version is household debt has increased from a little over 70% of total US GDP in 2001 to over 90% in the fourth quarter of 2007. In addition, over the same period of time household debt has increased from over 90% of disposable income to over 130%. Mortgage debt is the primary reason for this increase, as households went on a huge home buying and mortgage equity withdrawal binge over the last few years.
However, I also predicted that the high debt load would lead to a recession or economic slowdown. While the economy did slow in the first quarter of 2007, predictions are for an increase in the second quarter. In other words, my analysis was right by my conclusion was wrong. At least it was wrong.
Is something different now? Has consumer spending reached a point where it will no longer increase, driving economic growth? I don't have an answer for that. However, the initial signs are the consumer is slowing his purchases -- at least for now.
However, history has demonstrated the US consumer loves to shop, and will do almost anything to continue shopping. The US economy has had more than ten straight years of quarterly increases in consumer spending.
For now, I will punt this question but will be thinking about it for quite some time.
Payrolls Increase 132,000
From the BLS:
However, the BLS revised the two previous reports higher by 75,000.
There are some big areas of concern in this report.
1.) Manufacturing lost 18,000. Most of the manufacturing indicators (such as the ISM and the various regional Federal Reserve reports) have given a positive signal for manufacturing. Yet the sector continues to shed jobs. Part of this is the increased productivity of the sector. However, I have to wonder if there is something else going on as well.
2.) Construction jobs increased 12,000. It appears commercial construction projects are absorbing the loss of jobs in the residential construction area.
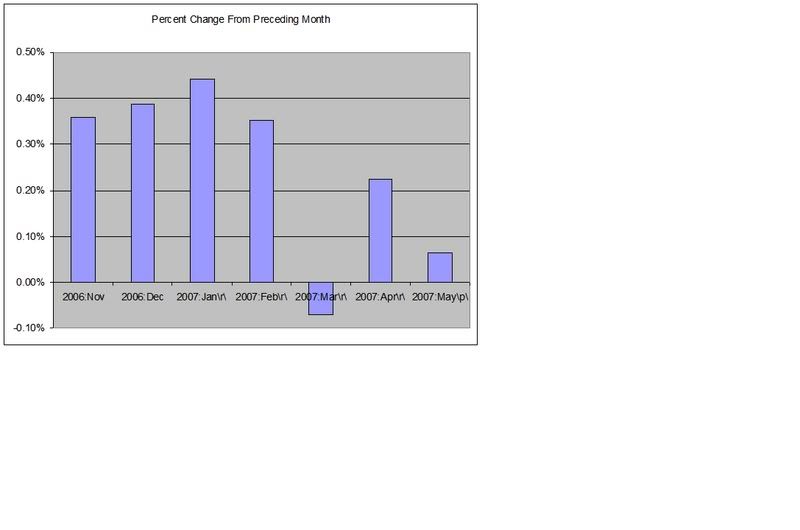
3.) Retail lost 24,000 jobs. This is further confirmation of a slowdown in consumer spending. Here is a chart of chained 2000 dollar month over month increases in personal consumption expenditures for the last 7 months. Notice that sales have slowed the last three months.
4.) Education/health services added 59,000 and leisure/hospitality added 39,000. Neither of these areas are considered high-pay areas. Regarding health services, note where the jobs were created:
5.) Professional and business services lost 9,000 jobs. The report notes the slowdown in this area:
Employment growth is one of the bullish arguments for the economy going forward. If the headlines focus only on top-line growth, this report should help although it is not a blockbuster. However, looking at the details a different picture emerges: Slowing retail and professional services growth, the continued decline in manufacturing and a big addition of lower-paying jobs.
Nonfarm payroll employment increased by 132,000 in June, and the unemployment rate was unchanged at 4.5 percent, the Bureau of Labor Statistics of the U.S. Department of Labor reported today. Employment rose in several service-providing industries, while manufacturing employment continued to decline. Average hourly earnings rose by 6 cents, or 0.3 percent, over the month.
However, the BLS revised the two previous reports higher by 75,000.
There are some big areas of concern in this report.
1.) Manufacturing lost 18,000. Most of the manufacturing indicators (such as the ISM and the various regional Federal Reserve reports) have given a positive signal for manufacturing. Yet the sector continues to shed jobs. Part of this is the increased productivity of the sector. However, I have to wonder if there is something else going on as well.
2.) Construction jobs increased 12,000. It appears commercial construction projects are absorbing the loss of jobs in the residential construction area.
3.) Retail lost 24,000 jobs. This is further confirmation of a slowdown in consumer spending. Here is a chart of chained 2000 dollar month over month increases in personal consumption expenditures for the last 7 months. Notice that sales have slowed the last three months.
4.) Education/health services added 59,000 and leisure/hospitality added 39,000. Neither of these areas are considered high-pay areas. Regarding health services, note where the jobs were created:
Health care employment grew by 30,000 in June, with gains in hospitals (+14,000) and in nursing and residential care facilities (+8,000).
5.) Professional and business services lost 9,000 jobs. The report notes the slowdown in this area:
Professional and business services employment was little changed in June. During the first 6 months of 2007, job growth in the industry averaged 13,000 per month compared with an average of 42,000 per month in the last half of 2006.
Employment growth is one of the bullish arguments for the economy going forward. If the headlines focus only on top-line growth, this report should help although it is not a blockbuster. However, looking at the details a different picture emerges: Slowing retail and professional services growth, the continued decline in manufacturing and a big addition of lower-paying jobs.
Is It Time To Go Long?
Several technical indicators have given preliminary buy signals on the SPY. The MACD has turned bullish and the CMF is hovering around 0 where a few strong days could send the indicator into buy territory.
However, there are two concerns going forward.
1.) Here is a 5-year, weekly chart. Notice the index has moved up strongly and sharply over the last few months. In addition, notice the big pick-up in volume during this rally. This could be a buying climax, which is a sign of a market top.
2.) In addition, we are still in a downward trend with lower lows and lower highs. The market would have to break through the top downward sloping line and/or move above a previous high on decent volume to give a buy signal.
Thursday, July 5, 2007
Junk Bond Market About to Take A Hit?
Right now, the spread between junk bonds and treasury debt is very tight. This indicates that junk bonds have reallied over the last few years. It also indicates there may be a pricing mis-match in the market. Junk debt has more risk, yet is not trading like it has more risk.
However:
If this trend continues, it will be another sign that the LBO market will at minimum go through a minor shake-out.
However:
Junk bonds lost 1.61 percent last month, the most since March 2005 when GM forecast its biggest quarterly loss since 1992. Junk bonds globally returned 2.88 percent in the first half, the lowest in two years, according to data from New York- based Merrill Lynch.
Investors withdrew $502 million from high-yield mutual funds in the week ended June 20, the most since September 2005, according to AMG Data Services in Arcata, California.
.....
``Demand has spiraled out of control,'' said Sethi, who helps oversee $2 billion at Fidelity International, an affiliate of Boston-based Fidelity Investments. ``We think the market is overpriced. There's a little bit more scope for spreads to tighten, but a lot more scope for widening.''
If this trend continues, it will be another sign that the LBO market will at minimum go through a minor shake-out.
Big Investment Companies Start to Boycott LBO Debt
From Bloomberg:
These are two big firms and one large money manager publicly stating they are concerned about the debt issued in some of the recent IPO deals. This is big news because it indicates the buyers market for the debt from these deals is shrinking.
LBOs have been a primary driver of the stock market in the most recent advance. Yet there has been a ton of news related to the mortgage bond and LBO business as of late -- none of which has been good.
If these deals go away or decrease, will the market still be able to advance? Is there another driver out there for increased stock prices?
The world's biggest bondholders have had their fill of leveraged buyouts, convinced that increasing mortgage delinquencies will drag down the U.S. economy and drive debt-laden companies into default.
TIAA-CREF, which oversees $414 billion in retirement funds for teachers and college professors, is boycotting some debt offerings used to finance LBOs. Fidelity International, a unit of the world's largest mutual fund company, and Lehman Brothers Asset Management LLC, the money-management arm of the third- biggest bond underwriter, say they're avoiding debt from buyouts.
Investors are getting skittish just as private-equity firms led by Kohlberg Kravis Roberts & Co. and Blackstone Group Inc. prepare to sell $300 billion of bonds and loans to finance LBOs, according to Bear Stearns Cos. In the past two weeks alone, more than a dozen companies were forced to postpone or restructure debt sales.
``There are some very scary analogies between high yield and the mortgage market,'' said Kevin Lorenz, a managing director who oversees $2.5 billion of high-yield assets at TIAA- CREF in New York. ``You cannot do fundamental analysis and believe that those are creditworthy companies.''
These are two big firms and one large money manager publicly stating they are concerned about the debt issued in some of the recent IPO deals. This is big news because it indicates the buyers market for the debt from these deals is shrinking.
LBOs have been a primary driver of the stock market in the most recent advance. Yet there has been a ton of news related to the mortgage bond and LBO business as of late -- none of which has been good.
If these deals go away or decrease, will the market still be able to advance? Is there another driver out there for increased stock prices?
Home Inventories Continue to Grow
From the WSJ:
This is almost becoming comical -- if it wasn't so serious. The inventory of existing homes on the market is at a historical absolute high in terms of total units on the market. Yet the number of homes for sale continues to grow. At some point, prices will have to give and it won't be pretty.
Total listings of homes in these metro areas at the end of June was up 2.5% from May, according to figures compiled by ZipRealty Inc., a national real-estate brokerage firm based in Emeryville, Calif. The data cover all listings of single-family homes, condominiums and town houses on local multiple-listing services in those areas.
This is almost becoming comical -- if it wasn't so serious. The inventory of existing homes on the market is at a historical absolute high in terms of total units on the market. Yet the number of homes for sale continues to grow. At some point, prices will have to give and it won't be pretty.
Wednesday, July 4, 2007
Tuesday, July 3, 2007
More On PCEs
Here is a chart of the month over month percent change in personal consumption expenditures in chained 2000 dollars. Notice the drop-off.
Also see The Big Picture and Calculated Risk
Also see The Big Picture and Calculated Risk
Is Consumer Spending Slowing?
From Dow Jones:
Later in the report there is a comment that warm weather pulled people out to summer activities. Earlier this year, cold weather was the reason given for low retail sales figures.
However, according to the BEA, chained personal consumption expenditure increases for March, April and May were -.1, .2 and .1, respectively.
A slower pace of consumer spending also jibes with today's auto sales figures:
A slowdown in consumer spending also jibes with the chained disposable income figures from the BEA. For March, April and May, disposable income figures increased .3 -.6 and -.1 respectively. These figures bring the low unemployment rate into question as well.
National chain store sales fell 1.1% in the first four weeks of June versus the previous month, according to Redbook Research's latest indicator of national retail sales released Tuesday.
The drop in the index compared with a targeted 0.8% drop.
The Johnson Redbook Index also showed seasonally adjusted sales in the four week period rose 1.6% compared with June 2006 and relative to a 1.9% targeted gain.
Redbook said on an unadjusted basis, sales in the week ended June 30 were up 1.2% from the same week in 2006, after a 1.4% increase the previous week. June is a five-week month on the fiscal calendar, ending Saturday, July 7.
Later in the report there is a comment that warm weather pulled people out to summer activities. Earlier this year, cold weather was the reason given for low retail sales figures.
However, according to the BEA, chained personal consumption expenditure increases for March, April and May were -.1, .2 and .1, respectively.
A slower pace of consumer spending also jibes with today's auto sales figures:
Overall, the total industry sales rate looked to come in at about 16.1 million vehicles, lagging Thomson First Call estimates of about 16.5 million. There was one extra selling day in June 2007 than a year earlier.
"As we look at the results coming in, the performance is capping off a second quarter for the industry that I think can best be described as a bit underperforming," Paul Ballew, GM's top sales analyst, said in a conference call. "We're dealing with the twofold impact of gas prices and the housing correction that is occurring in a couple of key states."
A slowdown in consumer spending also jibes with the chained disposable income figures from the BEA. For March, April and May, disposable income figures increased .3 -.6 and -.1 respectively. These figures bring the low unemployment rate into question as well.
Energy Costs Highest Since 1987
From the Christian Science Monitor (hat tip Kirk report):
I've written a fair amount about gas prices for several reasons.
1.) Consumers see gas prices at least once a week if not more. As a result, these prices have a tremendous impact on consumer sentiment and spending habits.
2.) Despite the Federal Reserve's love of core inflation, total inflation is what consumers see on a regular basis. Energy and food prices are prices that have the most impact on consumer's inflation expectations.
3.) As fuel prices increase, discretionary income for other items decreases. This will have an impact on retail sales and other consumer purchases.
4.) I would argue there is a gradual inflection point with energy prices. At some point, energy prices will hit a level where consumer sentiment and spending take a disproportionate hit. I don't know what that level is, but I would guess it would start at about the $3.25/gallon area.
Kilowatts, gallons — they all add up. Energy is now sucking money out of Americans' bank accounts at a record level — hitting $612 billion at an annual rate in the month of April, the last month of data. Over the past two years, energy bills as a share of income have risen and are now at their highest point since 1987, but still below the levels of the 1970s and early 1980s. For low-income households, some economists estimate energy consumption as a percentage of income is closing in on 10 percent.
I've written a fair amount about gas prices for several reasons.
1.) Consumers see gas prices at least once a week if not more. As a result, these prices have a tremendous impact on consumer sentiment and spending habits.
2.) Despite the Federal Reserve's love of core inflation, total inflation is what consumers see on a regular basis. Energy and food prices are prices that have the most impact on consumer's inflation expectations.
3.) As fuel prices increase, discretionary income for other items decreases. This will have an impact on retail sales and other consumer purchases.
4.) I would argue there is a gradual inflection point with energy prices. At some point, energy prices will hit a level where consumer sentiment and spending take a disproportionate hit. I don't know what that level is, but I would guess it would start at about the $3.25/gallon area.
Hedge Fund Closes Redemptions
From Bloomberg:
In this article at the Huffington Post I argued the market would eventually be alright, but we would see a few poorly managed funds take a big hit. This is what appears to be happening.
The main issue right now is investor confidence in these funds and this market. If we see a rash of redemptions we could see a big problem emerge very quickly.
John Devaney, who invests in subprime- mortgage bonds, restricted redemptions to protect some of his Horizon Strategy hedge funds from being forced to sell assets.
It's ``a defensive move because we had an unusually high number of redemption requests,'' Michael Gregory, a spokesman for Devaney's United Capital Markets Holdings Inc., said in an interview yesterday. One of the investors who wanted to withdraw accounted for about 25 percent of the funds' money. United Capital, based in Key Biscayne, Florida, had about $619 million as of March, including the money-losing Horizon ABS Fund LP
....
In addition to the Bear Stearns funds, this year's declines have claimed UBS AG's New York-based Dillon Read Capital Management LLC hedge fund and Caliber Global Investment Ltd., a $908 million fund managed in London by Cambridge Place Investment Management LLP. Both have been shut down.
In this article at the Huffington Post I argued the market would eventually be alright, but we would see a few poorly managed funds take a big hit. This is what appears to be happening.
The main issue right now is investor confidence in these funds and this market. If we see a rash of redemptions we could see a big problem emerge very quickly.
A Technical Look At the SPYs
Yesterday's rally was technically important for a few reasons.
1.) The SPYs closed above the 10, 20, and 50 day SMA. If prices continue to trade above the SMAs they will pull them up. This will increase the SMAs and will eventually give them an upward angle, which is a bullish indicator.
However, the 10 day SMA is below the 20 SMA and crossed below the 50 day SMA on Friday. The 20 day SMA is close to crossing below the 50 day SMA and will probably do so in the next few days. Both of these are considered negative indicators.
The MACD has decreased for the last two months and appears close to giving a buy signal over the next few trading days.
The CMF went positive yesterday, another bullish signal.
The SPYs came close to hitting the 38% fibonacci retracement in their latest sell-off. I'm not a strict fibnocacci guy; if the chart come close to a fib number it's usually good enough.
Monday, July 2, 2007
ISM Increases
From the Institute for Supply Management:
A few notes.
1.) This is a good report. There are a group of economists currently arguing that business spending and growth will keep the economy from falling into a recession. This helps to bolster that argument.
2.) "Busy now but still down approximately 13 percent from this time last year." This comment jibes with the following information from Barron's pulse of the economy section. This indicates things are improving, but are still in general below year ago levels.
3.) Commodities and Industrials have been strong performers for the last half year. Some of these industries have sold off over the recent pullback. However, this news might make those areas more attractive again.
In June, manufacturing expanded at its fastest pace since April 2006 when the PMI Index registered 56.9. This performance appears sustainable in the third quarter due to the current strength in New Orders and Production."
WHAT RESPONDENTS ARE SAYING ...
* "Business remains brisk with isolated areas of softness." (Nonmetallic Mineral Products)
* "Things are picking up." (Primary Metals)
* "Busy now but still down approximately 13 percent from this time last year." (Fabricated Metal Products)
* "Exchange rate and some raw material increases have had a negative impact on our purchased components." (Transportation Equipment)
* "Petroleum-based material prices have begun to escalate at a faster pace." (Paper Products)
A few notes.
1.) This is a good report. There are a group of economists currently arguing that business spending and growth will keep the economy from falling into a recession. This helps to bolster that argument.
2.) "Busy now but still down approximately 13 percent from this time last year." This comment jibes with the following information from Barron's pulse of the economy section. This indicates things are improving, but are still in general below year ago levels.
3.) Commodities and Industrials have been strong performers for the last half year. Some of these industries have sold off over the recent pullback. However, this news might make those areas more attractive again.
The Pros and Cons Going into the Third Quarter
Let's look at the pros and cons of the market as the third quarter begins.
Earnings Concerns
The expectations for first quarter earnings were low as well. Analysts and companies issued very conservative guidance because of the slowing economy. As a a result, many companies surprised to the upside, adding fuel to the bulls argument.
International Sales
This was one of the main reasons for the surprising strength of some earnings reports. Companies with strong international exposure were the obvious beneficiaries of this trend. The rest of the world still looks like they will do well in the second half of the year, so this trend will probably continue.
Mergers and Acquisitions
The drop-off may simply be seasonal; M&A firms obviously had a ton of deals in the pipe which they continually announced over the last few quarters. However, there may also be a problem developing with the financing of these deals. The Bear hedge fund problems may tighten the lending markets, preventing some of these deals from going through. There has been a fair amount of press over the last week about lenders tightening standards in a variety of ways.
Housing
I debated this issued with Barry Ritholtz. There are plenty of reasons to be concerned, but I think what we'll see is a few funds having big problems, but a limited broader impact. I should add, this is a developing situation and as more facts come out that conclusion will either be supported or shot down.
There is also the possible impact on the economy as a whole. The housing market will go through another 12-18 months of mortgage rate resets. These will continually add downward pressure on the economy as a whole.
Earnings Concerns
Second-quarter earnings growth is so far expected to fall further to 4.3%, even though rising energy prices seem poised to given another lift to earnings.
The expectations for first quarter earnings were low as well. Analysts and companies issued very conservative guidance because of the slowing economy. As a a result, many companies surprised to the upside, adding fuel to the bulls argument.
International Sales
But the market thus far remains confident that strong global growth, led by China and Asia, will continue to boost U.S. profits, even as the economy slows.
This was one of the main reasons for the surprising strength of some earnings reports. Companies with strong international exposure were the obvious beneficiaries of this trend. The rest of the world still looks like they will do well in the second half of the year, so this trend will probably continue.
Mergers and Acquisitions
This year's record pace of takeovers slowed by 49 percent in June, data compiled by Bloomberg show. Delaware Investments, the Hartford and City National Bank, which manage more than $500 billion, say the decline plus the decision by leveraged buyout firm Blackstone Group LP to sell shares to the public are signaling that the five-year bull market is nearing an end.
The drop-off may simply be seasonal; M&A firms obviously had a ton of deals in the pipe which they continually announced over the last few quarters. However, there may also be a problem developing with the financing of these deals. The Bear hedge fund problems may tighten the lending markets, preventing some of these deals from going through. There has been a fair amount of press over the last week about lenders tightening standards in a variety of ways.
Housing
Adding to existing concerns, the woes of the housing market and the resulting meltdown in the subprime-mortgage market have claimed new victims. Two hedge funds owned by Bears Stearns & Co. were brought close to collapse two weeks ago.
I debated this issued with Barry Ritholtz. There are plenty of reasons to be concerned, but I think what we'll see is a few funds having big problems, but a limited broader impact. I should add, this is a developing situation and as more facts come out that conclusion will either be supported or shot down.
There is also the possible impact on the economy as a whole. The housing market will go through another 12-18 months of mortgage rate resets. These will continually add downward pressure on the economy as a whole.
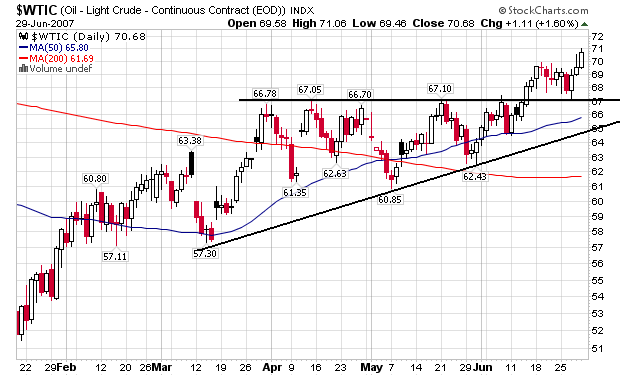
Oil Crosses $70/bbl
From Bloomberg:
It's been awhile since we've looked at oil prices, so let's see what the daily and weekly charts say.
The $67/bbl area provided a ton of resistance to oil's price for about two months. But oil broke through in mid-June. In addition, oil retreaded back to the $67 area later in the month and instead used the $67 price level for support.
We also have an ascending triangle formation, which is usually another bullish sign.
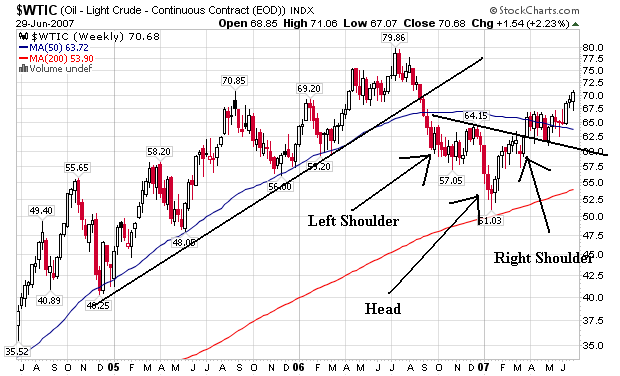
The weekly chart says oil has consolidated in the head and shoulders formation and is now advancing, using the neckline as preliminary support.
Oil prices jumped 2.2 percent last week, the third straight weekly gain, after the U.S. government said gasoline stockpiles unexpectedly fell the week before. This week, a record 41.1 million vacationers in the U.S. will travel for the July 4 Independence Day holiday, according to AAA motorist club. More than a third of those surveyed planned to start driving last week.
Crude price are rising ``because of tightness on the refinery side, some maintenance or some accidents, and the utilization rate isn't so high,'' Kenichiro Yamaguchi, the chief operating officer for Petro Diamond Risk Management Ltd. in London, a unit of Mitsubishi Corp., Japan's largest trading company. ``The market is strong on the product side,'' with high demand for distillates, including heating oil, and gasoline.
It's been awhile since we've looked at oil prices, so let's see what the daily and weekly charts say.
The $67/bbl area provided a ton of resistance to oil's price for about two months. But oil broke through in mid-June. In addition, oil retreaded back to the $67 area later in the month and instead used the $67 price level for support.
We also have an ascending triangle formation, which is usually another bullish sign.
The weekly chart says oil has consolidated in the head and shoulders formation and is now advancing, using the neckline as preliminary support.
Subscribe to:
Posts (Atom)