Saturday, November 4, 2023

Weekly Indicators for October 30 - November 3 at Seeking Alpha


 - by New Deal democrat

My Weekly Indicators post is up at Seeking Alpha.

One way I keep track of the producer side of the economy is via the long leading indicator of corporate profits and the short leading indicator of the stock market. As is implied, the former has a long history of leading the latter. Except that the stock market turned down in 2022 before profits did, and rose at the end of 2022 before profits did.

Now the stock market has been in a 3+ month downtrend after failing to make a new high, while corporate profits have risen sharply in Q3 to new all-time highs.

Meanwhile the last real estate indicator has rolled over.

But consumer spending has been increasing, and gas prices are in a renewed downtrend.

Lots to parse through. Clicking over and reading will give you all the details, and provide me with a penny or two for my efforts.

Friday, November 3, 2023

October jobs report: more deceleration, in the weakest report (except for June’s) since March 2021


 - by New Deal democrat


As per my reporting earlier this week, I was looking for 3 things: (1) whether the unemployment rate, which follows initial jobless claims, would remain elevated compared with 1 year ago (it did), whether average hourly earnings gains for non-supervisory workers would continue to decline (they did), and whether jobs growth itself would suggest a “soft landing” stabilization or continue to decelerate (the data was equivocal, but is more likely demonstrating continued deceleration).

In short: yes, the leading indicators work.

This month’s data was significantly affected by the UAW strike. Where important, I have given the data ex-strike as well.

Here’s my in depth synopsis.


HEADLINES:
  • 150,000 jobs added (183,000 ex-strike). This is the lowest except for June. On a YoY basis, jobs are up 1.9%, the lowest % gain since March 2021.
  • August and September were both revised lower, by -62,000 and -39,000, respectively, for a net of -101,000. This continues the pattern that we have seen all year except for one month ago. As a result, the 3 month moving average declined to 204,000 (211,000 ex-strike) from a revised 233,000 last month. But the June-August average of 167,000 remains the low.
  • Private sector jobs increased only 99,000 (132,000 ex-strike). Government jobs increased by 51,000. This is a new low, including the strike. Excluding the strike, June-s 104,000 remains the low.
  • On the other hand, the alternate, and more volatile measure in the household report actually *declilned* by -348,000 jobs. The YoY% gain in this report is +1.7% (which is the average YoY gain for this whole year).
  • The U3 unemployment rate rose 0.1% to 3.9%, tied with last month for the highest since January 2022 . The civilian labor force, the denominator in the figure, declined (by -201,000), and the numerator, the number of unemployed, rose (by 146,000).
  • The U6 underemployment rate rose 0.2% to 7.2%, but still close to the highest since February 2022. 
  • Further out on the spectrum, those who are not in the labor force but want a job now declined -77,000 to 5.373 million, vs. its post-pandemic low of 4.925 million set this past March.

Leading employment indicators of a slowdown or recession

These are leading sectors for the economy overall, and help us gauge how much the post-pandemic employment boom is shading towards a downturn.  These were weakly positive:
  • the average manufacturing workweek, one of the 10 components of the Index of Leading Indicators, was unchanged at 40.7, equal to its lows earlier this year and down -0.8 hours from its February 2022 peak of 41.5 hours.
  • Manufacturing jobs declined by -35,000 (-2,000 ex-strike).
  • Within that sector, motor vehicle manufacturing jobs declined -33,000 (including the UAW strike). 
  • Construction jobs increased by 23,000.
  • Residential construction jobs, which are even more leading, rose by 3,700. There has been a sharp rebound in the past three months, but so far It continues to appear likely that January was the peak for this sector.
  • Goods jobs as a whole declned -11,000 (Up +22,000 ex-strike). These should decline before any recession occurs. They remain up 1.2% YoY (including the strike), which is nevertheless an average pace compared with most of the last 40 years.
  • Temporary jobs, which have generally been declining late last year, rose 6,600, but remain down -228,500 since their peak in March 2022.
  • the number of people unemployed for 5 weeks or less rose 217,000 to 2,268,000, the highest level since March.

Wages of non-managerial workers
  • Average Hourly Earnings for Production and Nonsupervisory Personnel increased $.10, or +0.3%, to $29.16, a YoY gain of +4.4%. This is the lowest since June 2021.

Aggregate hours and wages: 
  • the index of aggregate hours worked for non-managerial workers declined -0.2%, and is up 0.7% YoY, the lowest since March 2021.
  •  the index of aggregate payrolls for non-managerial workers rose less than 0.1%, and is up 5.2% YoY, a -0.5% decline from last month, and the lowest since March 2021. Nevertheless this is 2.0% above the most recent inflation rate, meaning average working class families have more buying power.

Other significant data:
  • Leisure and hospitality jobs, which were the most hard-hit during the pandemic, rose 19,000, which is still -223,000, or -1.3% below their pre-pandemic peak.
  • Within the leisure and hospitality sector, food and drink establishments rose declined -7,500, which remains -14,100, or -0.1%, below their pre-pandemic peak.
  • Professional and business employment rose 15,000. These tend to be well-paying jobs, But this series has been decelerating, and is currently up 1.0% YoY, its lowest YoY gain since March 2021.
  • The employment population ratio declined -0.2% to 60.2%, vs. 61.1% in February 2020.
  • The Labor Force Participation Rate declined -0.1% to 62.7%, vs. 63.4% in February 2020.


SUMMARY

With the possible exception of June, this month’s report was the weakest in over 2.5 years, as both the Establishment and Household portions were either weakly positive (the Establishment side) or negative (the Household side). 

Although the leading numbers in the report were on net positive, taking out the effects of the strike, private job gains were the poorest since December 2020 except for this past June. Gains in leisure and hospitality, hard hit during the pandemic, and the good-paying professional and business sector, were both anemic, as they have been for the past several months as well. Aggregate hours declined, and aggregate payrolls were flat. Unless there is an actual negative print in this month’s CPI report, this means that the real, inflation adjusted buying power of the middle and working classes will decline again. As anticipated via YoY jobless claims, the unemployment and underemployment rates both remained elevated compared with last year, and appear to be in an uptrend. 

There were positive signs, though, with continued gains in construction jobs in particular. The manufacturing work week has stopped declining and has stabilized.

Since June, jobs growth *may* have stabilized, but the YoY% gains have continued to decline at a rate of -0.1% each month on average. The evidence is not clear cut, but it is more likely that the decelerating trend is in place. If the “soft landing” in the economy is just a phase that we have been passing through, that will be revealed the first time they’re more monthly jobs gains under 100,000.


Thursday, November 2, 2023

Initial claims: were the recent lows just unresolved seasonality after all?


 - by New Deal democrat


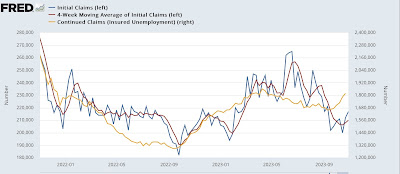
Initial jobless claims rose 5,000 to a 7 week high of 217,000 this week. The 4 week moving average rose 2,000 to 210,000 from its 9 month low of 208,000 last week. With the usual one week delay, continuing claims continued their recent sharp ascent, up 35,000 to 1.818 million. Aside from 2 weeks in April, this is the highest level of continuing claims since December 2021:


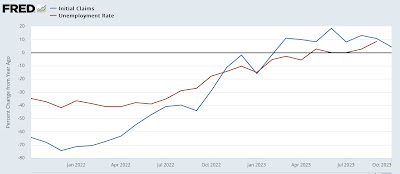
The YoY% changes, which are more important for forecasting, were higher by 6.4% for weekly claims, and 3.8% for the most important 4 week average. Continuing claims were higher by 27.0%:


Since initial claims are not higher by over 10% YoY, they indicate continued expansion.

Finally, the average of initial claims for the month of October was higher by 4.3% YoY. Since initial claims lead the unemployment rate by several months, this implies an unemployment rate of 3.7%-3.8% a few months from now (3.6%*1.043=3.75%):


Because several months ago initial claims averaged about 10% higher YoY, tomorrow we could see an unemployment rate as high as 4.0%, although 3.7% would not be inconsistent with the overall trend.

In addition to expecting an unemployment rate in the above range, based on the softness we saw in the quit rate in yesterday’s JOLTS report, I am looking for continued deceleration in wage gains to 4.2% or even 4.1% YoY, although a noisy increase to 4.5% would not be inconsistent with the downward trend.

As to job growth itself, last month’s increase of 336,000 was an outlier that was the highest since January, suggesting a possible break in the trend of deceleration. Tomorrow I will be looking to see if that was just noise or not. A significant downward revision would hardly be a surprise. 


Wednesday, November 1, 2023

September JOLTS report shows continued deceleration in all trends - except layoffs


 - by New Deal democrat


All of the major metrics in last month’s JOLTS report for August improved, most slightly, but the decelerating trend continued. In this morning’s report for September, that trend continued, as most of the metrics improved or declined very slightly, but the trends remained intact.


Here are openings (blue), hires (red), and voluntary quits (gold), all normed to 100 just before the pandemic:


As can be easily seen, for all intents and purposes both hiring and quitting are back to where they were in normal times before the pandemic, while openings - which are always suspect because many companies keep fictitious openings posted as a matter of routine - remain very elevated, at 36% higher. But all are in persistent downtrends.

The one exception this month was a sharp downturn in layoffs and discharges by -165,000 to 1.517 million, the lowest level since last December. This is in accord with the big September decline in initial jobless claims. As with the above graph, this one is also normed to its average right before the pandemic, showing that layoffs remain well below that level (further evidence of labor market tightness):


It’s possible this was affected by anticipation of the UAW strike. We’ll see next month. For the moment, though, this does break the upward trend in layoffs.

Finally, two months ago I premiered a comparison of the quits rate and average hourly earnings. This is because the former has a 20+ year history of leading the latter, which I have in the past described as a “long lagging” indicator that turns well after the turns in most other metrics. Here’s the update of that comparison:


The quits rate was unchanged in September, but as with the other JOLTS metrics, the downward trend remains fully intact. Thus on Friday we can expect to see a continuation of the trend in decelerating YoY wage gains, at or below 4.5%.

The new month of data begins: residential construction positive, job openings negative, and manufacturing mixed


 - by New Deal democrat

As usual, the monthly data started out with reports on the two most important production sectors of the economy, namely manufacturing (for October) and construction (for September). Additionally, the JOLTS jobs survey for September was released.

I am going to do more detailed reports on both JOLTS and construction later today or tomorrow. For now, let me just make a couple of drive-by comments.

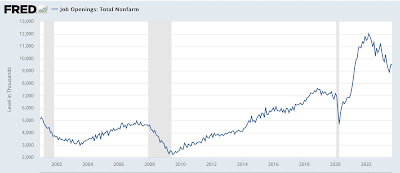
The most important segment of the JOLTS report right now are job openings, because they will tell us how much upward pressure remains in the jobs market due to employers being unable to fill vacant positions. And here, the news was slightly positive for the month, as openings increased 56,000 to 9.553 million. But the longer term downward trend is clearly intact:


Before the pandemic, openings averaged about 7.5 million. They peaked at just over 12 million in March 2022. For the last three months, they have averaged 9.3 million, more than halfway back to their pre-pandemic level. So there is still upward pressure on wages, but not nearly so acutely as before. Meaning it is reasonable to think that wage growth will continue to decelerate.


For construction, I’ll just quote from the report, which continued to show that despite massive interest rate increases, and a crash in mortgage applications, the news continues to be positive as to actual construction:


Construction spending during September 2023 was estimated at a seasonally adjusted annual rate of $1,996.5 billion, 0.4 percent (±1.2 percent)* above the revised August estimate of $1,988.3 billion. The September figure is 8.7 percent (±1.8 percent) above the September 2022 estimate of $1,836.9 billion….

Residential construction was at a seasonally adjusted annual rate of $872.0 billion in September, 0.6 percent (±1.3 percent)* above the revised August estimate of $866.6 billion. Nonresidential construction was at a seasonally adjusted annual rate of $683.9 billion in September, 0.1 percent (±0.7 percent)* above the revised August estimate of $683.0 billion.

Turning to manufacturing. The ISM’s diffusion index, where any value below 50 indicates contraction, came in negative for the 12th month in a row for the total index, and the 14th month in a row for new orders.

The overall index declined to 46.7, while the even more leading new orders subindex declined to 45.5. Both of these are frankly recessionary numbers. [The graph isn’t currently available updated, so I will update this post with it later. UPDATE: See graph below:].


But of course, they have been recessionary for almost the entire past year - and yet there has been no recession.

An important reason is that the ISM is a *diffusion* index, not a weighted one. And a very important but narrow part of manufacturing, motor vehicles, has been very positive. Perhaps until now.

Historically vehicle sales, especially truck sales, turn down well in advance of recessions:


But last Friday the most recent DoT report on car and truck sales shows that both have declined from their recent peaks:


This is within the range of noise, so while it is pretty clear that future new highs are very unlikely in the near term, we cannot yet conclude as to either segment of motor vehicles that there has been a decisive turn down.

So I will call the ISM report a mixed or neutral reading, awaiting further information from other motor vehicle data. Residential construction was clearly positive, and JOLTS remains elevated but trending downward.

Tuesday, October 31, 2023

House resale price indexes confirm upturn in prices for existing homes, but do not negative combined price declines


 - by New Deal democrat


We got more price information about the very important housing market this morning.


Through September, the median price of home resales as measured by Case Shiller increased 0.9% monthly. For the FHFA Index they rose 0.6%. Both measures are up about 46% since just before the pandemic hit (note: FRED hasn’t updated the FHFA index yet):


On a YoY basis, prices have rebounded in both indexes, 5.6% for the FHFA and 2.6% in the Case Shiller National index. Since historically the FHFA has tended to slightly lead the Case Shiller index, unsurprisingly the upturn in the former index is now showing up in the latter:


Because both these indexes measure resales of the same unit, by definition they are existing home sales. For comparison, here is the last 12 months, not seasonally adjusted, of the median price of existing homes:


YoY they are up 2.8%, right in line with the Case Shiller outcome.

So, are price declines in the overall housing market over? No! 

Remember that this housing market has been severely bifurcated, due to most existing homeowners being frozen in place by their existing 3% mortgages, so buyers have flocked to new homes (and especially new condos and apartments), where volume is at or near all-time highs, prices have come down substantially, and builders are offering mortgage subsidies for the first several years of ownership.

To show you the overall impact, below is a graph of both new + existing home sales over the past year (remember that’s all that the NAR lets FRED publish) (blue), compared with the average of new + existing home prices (red):


On a combined basis, sales are down -10% YoY, and prices are down -5.5% YoY. Once we look at the combined data, it is easy to see that even in this severely bifurcated market, sales have led prices.

Finally, because home prices lead the CPI measure of “owner’s equivalent rent” by 12 months or more, here is an update of the YoY% changes in both the FHFA and Case Shiller Indexes vs. OER for the pat 25 years:


In the past 5 months, on a YoY basis OER has declined from 8.1% to 7.1%. If anything, I expect the decline to pick up speed from here. Because existing home prices spent so little time at the zero line before turning up again, it’s possible that OER will only decline to 2%-2.5% in the next 12 months or so. But because so many competing new house and apartment have been built, and aren’t reflecting in resales, OER could well decline lower than that on a YoY basis. We’ll see.

Monday, October 30, 2023

Coronavirus update through October 30, 2023


 - by New Deal democrat


No important economic news today, but it’s been a while since I took a look at the COVID-19 data, and there is an interesting trend, so let’s have at it!


But first, some bad news. The most reliable data for infections for the past year has been from Biobot, which tracked wastewater nationwide. Well, they lost their contract, which was won by a Google subsidiary called Verily. And Verily has all but rendered the data useless. In particular, they do not track any aggregate levels of COVID particles in wastewater regionally or nationwide. The sole option they provide is to show individual plants’ data. So there is no way to know what any regional or national trend is.

In short, all but totally worthless.

The CDC is still providing weekly updates on hospitalizations and deaths. And the data continues to show how COVID is much less virulent than it once was, whether because of mass vaccinations, near universal previous infections, and/or mutations in the virus itself.

As to hospitalizations, in the first year of the pandemic, weekly hospitalizations never declined below about 22,000:


But in the past year, in every period except last winter - between Thanksgiving and the end of Feburary - hospitalizations have *always* been under 22,000, hitting an all time low of about 6,000 this past summer:


Even now, hospitalizations are only about 16,000, about 75% of their level one year ago.

The news is even more promising when it comes to deaths.

For the last 18 months, deaths have been sharply lower than they were during the first 2 years of the pandemic:


During the first 2 years, with the exception of the brief respite during the summer of 2021, deaths never declined below 3,800 per week. But since then, with the exception of one week last January, deaths have never been *above* 3,800 per week.

And the news has continued to improve this year. 

Because the virus displays some seasonality (probably having to do with large winter gatherings indoors), below I break down deaths in 6 and 12 month increments, to show how the death toll has been declining over time. The first number is the 6 month total (in thousands), the 2nd the 12 month total:

4/1/20-9/30/20:  211
10/1/20-3/31/21:  353 [564]
4/1/21-9/30/21: 166 [519]
10/1/21-3/31/22:  267 [433]
4/1/22-9/30/22: 62 [329]
10/1/22-3/31/23: 65 [127]
4/1/23-9/30/23: 23 [88]

As with economic data, the 12 month moving average takes away the seasonality issue. And we can see that the 12 month total has been relentlessly declining. Indeed, for the last 12 months it has equaled about an average annual flu season.

And here is the breakdown between warmer and colder seasons over time:
Colder: 353, 267, 65
Warmer: 211, 166, 62, 23

If this decline in virulence holds for this colder season as well, I would expect less than 50,000 deaths, and perhaps as low as about 30,000. As usual, these are mainly going to be among the elderly and the unvaccinated.

One fly in the ointment:  it had occurred to me that some of these deaths might be among people who would otherwise have died from the flu, but that does not seem to be an important factor. In the 10 years before the pandemic, an average of 35,000 people a year died from the flu. In 2021-22, only 5,000 died. But in 2022-23, the preliminary estimate from the CDC - with a huge confidence band - is somewhere between 17,000 and 98,000.